29
/it/
it
AIzaSyAYiBZKx7MnpbEhh9jyipgxe19OcubqV5w
April 1, 2024
226423
Portugal
PRT
true
2
1
Stocks traded, total value (% of GDP)
2015,2014,2013,2012,2011,2010,2009,2008,2007,2006,2005,2004,2003,2002,2001,2000,1999,1998,1997,1996,1995,1994
Download
Biblioteca di statistiche globali →Portugal →

Stocks traded, total value (% of GDP)

Queste statistiche in altri paesi:
Arab WorldArgentinaArmeniaAustraliaAustriaBahrainBangladeshBarbadosBelgiumBermudaBoliviaBotswanaBrazilBulgariaCanadaCayman IslandsCentral Europe and the BalticsChannel IslandsChileChinaColombiaCosta RicaCote d'IvoireCroatiaCyprusCzech RepublicDenmarkEarly-demographic dividendEast Asia & PacificEast Asia & Pacific (excluding high income)East Asia & Pacific (IDA & IBRD countries)EcuadorEgypt, Arab Rep.El SalvadorEstoniaEuro areaEurope & Central AsiaEurope & Central Asia (excluding high income)Europe & Central Asia (IDA & IBRD countries)European UnionFijiFinlandFranceGeorgiaGermanyGhanaGreeceGuyanaHigh incomeHong Kong SAR, ChinaHungaryIBRD onlyIcelandIDA & IBRD totalIDA blendIDA totalIndiaIndonesiaIran, Islamic Rep.IrelandIsraelItalyJamaicaJapanJordanKazakhstanKenyaKorea, Rep.KuwaitKyrgyz RepublicLate-demographic dividendLatin America & Caribbean Latin America & Caribbean (excluding high income)Latin America & the Caribbean (IDA & IBRD countries)LatviaLebanonLithuaniaLow & middle incomeLower middle incomeLuxembourgMacedonia, FYRMalawiMalaysiaMaltaMauritiusMexicoMiddle East & North AfricaMiddle East & North Africa (excluding high income)Middle East & North Africa (IDA & IBRD countries)Middle incomeMoldovaMongoliaMontenegroMoroccoNamibiaNetherlandsNew ZealandNigeriaNorth AmericaNorwayOECD membersOmanOther small statesPakistanPanamaPapua New GuineaParaguayPeruPhilippinesPolandPortugalPost-demographic dividendQatarRomaniaRussian FederationSaudi ArabiaSerbiaSeychellesSingaporeSlovak RepublicSloveniaSouth AfricaSouth AsiaSouth Asia (IDA & IBRD)SpainSri LankaSt. Kitts and NevisSub-Saharan Africa Sub-Saharan Africa (excluding high income)Sub-Saharan Africa (IDA & IBRD countries)SwazilandSwedenSwitzerlandTanzaniaThailandTrinidad and TobagoTunisiaTurkeyUgandaUkraineUnited Arab EmiratesUnited KingdomUnited StatesUpper middle incomeUruguayUzbekistanVenezuela, RBVietnamWest Bank and GazaWorldZambiaZimbabwe
Linea del tempo:
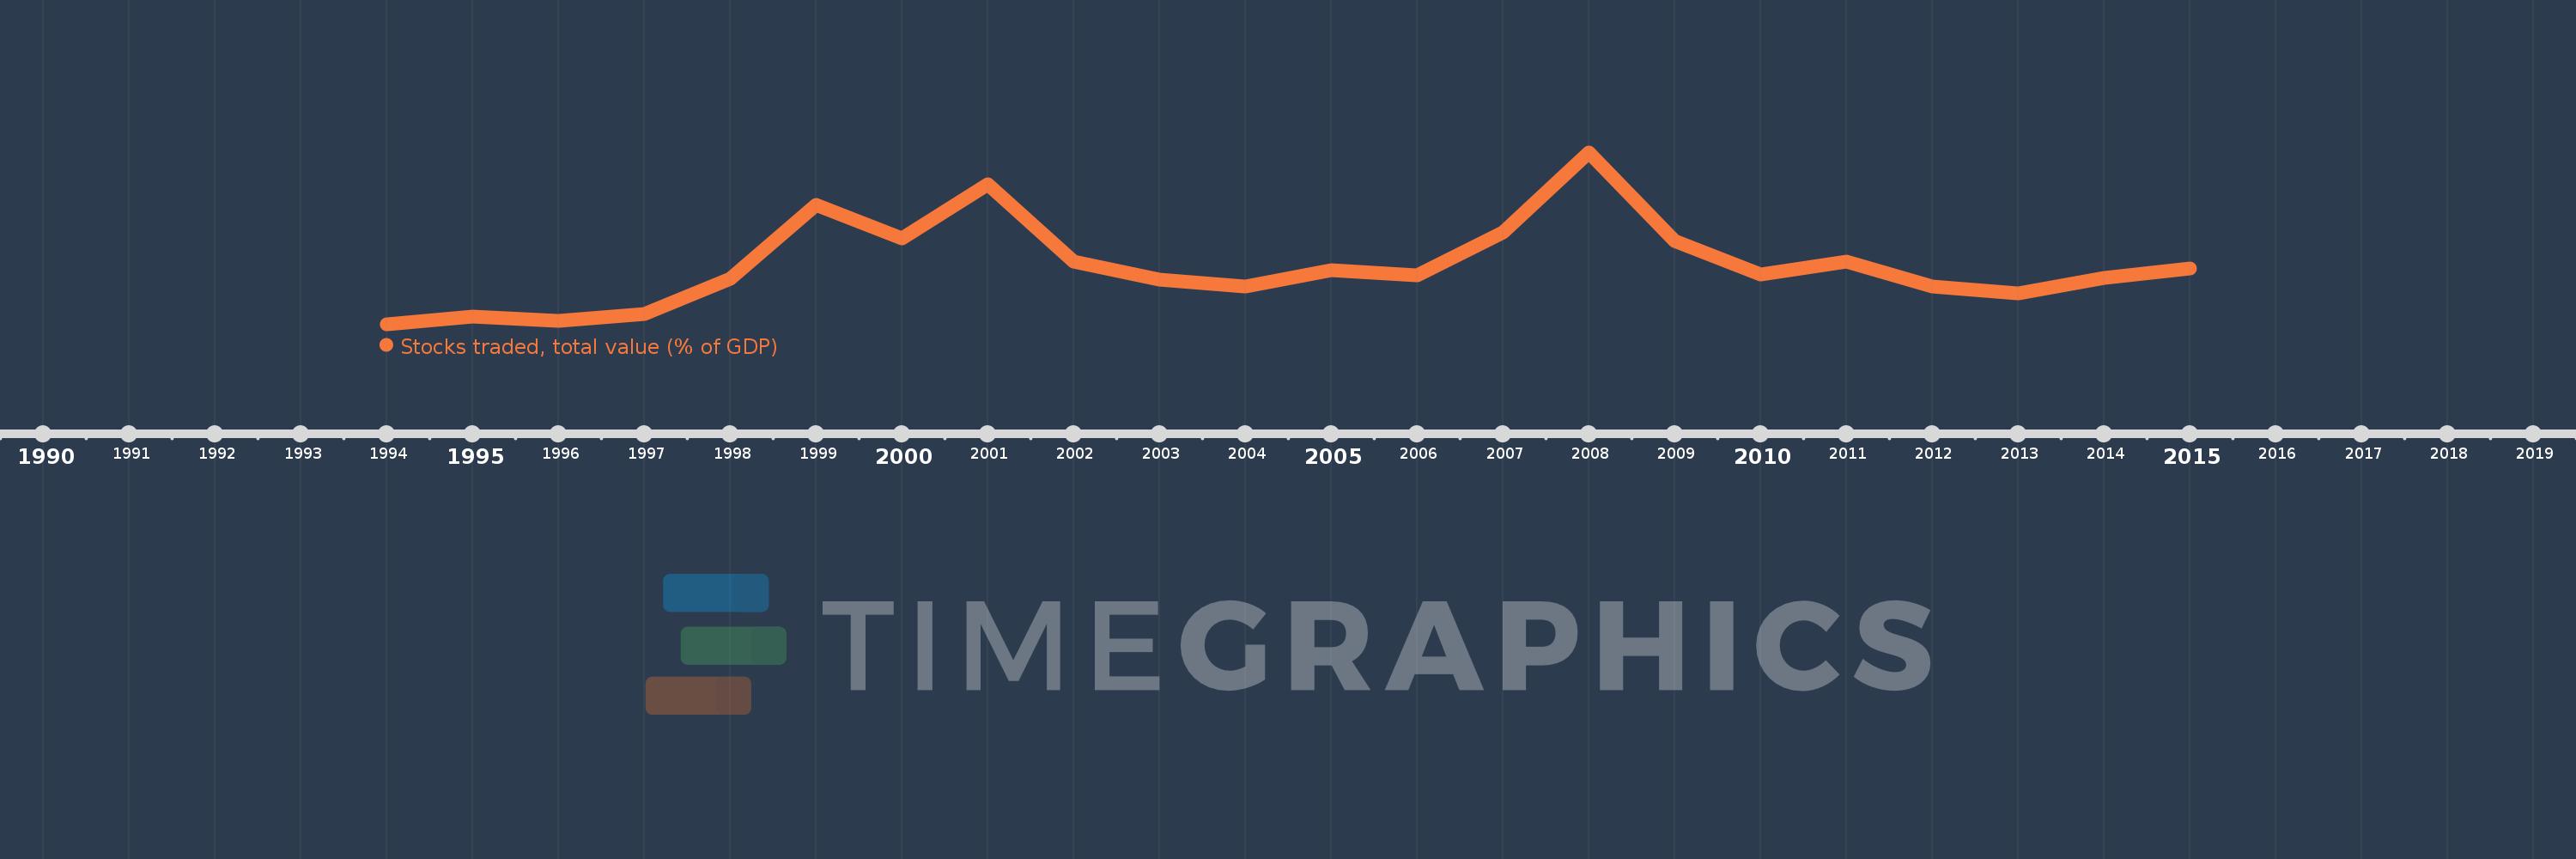
Questa scala temporale mostra un grafico dal 1994 anno al 2015 anno. Portugal. I dati fino ad 1993 anno non disponibili. Il numero di osservazioni attuali secondo i date: 22.
La fonte (nome):
Indicatori dello sviluppo mondiale
La fonte (organizzazione):
World Federation of Exchanges database.
Categorie:
Financial Sector
sono stati aggiornati
23 apr 2017 anni
Indicatori delle variazioni dei valori per anni
In media:
21.173
Minima:
2.522
1 gen 1994 anni
Massimo:
57.21
1 gen 2008 anni
Alla data di osservazione
Valore
Variazione assoluta
La variazione rispetto al valore precedente
1 gen 1994 anni
2.522
+2.522
0.0%
1 gen 1995 anni
4.994
+2.471
97.97%
1 gen 1996 anni
3.566
-1.428
-28.59%
1 gen 1997 anni
5.773
+2.207
61.89%
1 gen 1998 anni
16.99
+11.218
194.33%
1 gen 1999 anni
40.509
+23.518
138.42%
1 gen 2000 anni
29.94
-10.569
-26.09%
1 gen 2001 anni
46.963
+17.023
56.86%
1 gen 2002 anni
22.449
-24.514
-52.2%
1 gen 2003 anni
16.807
-5.642
-25.13%
1 gen 2004 anni
14.489
-2.318
-13.79%
1 gen 2005 anni
19.619
+5.13
35.41%
1 gen 2006 anni
18.107
-1.512
-7.71%
1 gen 2007 anni
31.662
+13.555
74.86%
1 gen 2008 anni
57.21
+25.548
80.69%
1 gen 2009 anni
28.972
-28.239
-49.36%
1 gen 2010 anni
18.367
-10.604
-36.6%
1 gen 2011 anni
22.513
+4.145
22.57%
1 gen 2012 anni
14.556
-7.956
-35.34%
1 gen 2013 anni
12.218
-2.338
-16.06%
1 gen 2014 anni
17.239
+5.021
41.09%
1 gen 2015 anni
20.34
+3.1
17.99%
Classificazione dei paesi secondo i statistiche attuali per anni

Commenti:

Inviare
PremiumAbout & FeedbackAccordoPrivatezza
logo
© 2022 Selected Technologies LLC – Morgan Hill, California