29
/it/
it
AIzaSyAYiBZKx7MnpbEhh9jyipgxe19OcubqV5w
April 1, 2024
249482
Sri Lanka
LKA
true
2
1
Stocks traded, total value (% of GDP)
2016,2015,2014,2013,2012,2011,2010,2009,2008,2007,2006,2005,2004,2003,2002,2001,2000,1999,1998,1997,1996,1995,1994
Download
Biblioteca di statistiche globali →Sri Lanka →

Stocks traded, total value (% of GDP)

Queste statistiche in altri paesi:
Arab WorldArgentinaArmeniaAustraliaAustriaBahrainBangladeshBarbadosBelgiumBermudaBoliviaBotswanaBrazilBulgariaCanadaCayman IslandsCentral Europe and the BalticsChannel IslandsChileChinaColombiaCosta RicaCote d'IvoireCroatiaCyprusCzech RepublicDenmarkEarly-demographic dividendEast Asia & PacificEast Asia & Pacific (excluding high income)East Asia & Pacific (IDA & IBRD countries)EcuadorEgypt, Arab Rep.El SalvadorEstoniaEuro areaEurope & Central AsiaEurope & Central Asia (excluding high income)Europe & Central Asia (IDA & IBRD countries)European UnionFijiFinlandFranceGeorgiaGermanyGhanaGreeceGuyanaHigh incomeHong Kong SAR, ChinaHungaryIBRD onlyIcelandIDA & IBRD totalIDA blendIDA totalIndiaIndonesiaIran, Islamic Rep.IrelandIsraelItalyJamaicaJapanJordanKazakhstanKenyaKorea, Rep.KuwaitKyrgyz RepublicLate-demographic dividendLatin America & Caribbean Latin America & Caribbean (excluding high income)Latin America & the Caribbean (IDA & IBRD countries)LatviaLebanonLithuaniaLow & middle incomeLower middle incomeLuxembourgMacedonia, FYRMalawiMalaysiaMaltaMauritiusMexicoMiddle East & North AfricaMiddle East & North Africa (excluding high income)Middle East & North Africa (IDA & IBRD countries)Middle incomeMoldovaMongoliaMontenegroMoroccoNamibiaNetherlandsNew ZealandNigeriaNorth AmericaNorwayOECD membersOmanOther small statesPakistanPanamaPapua New GuineaParaguayPeruPhilippinesPolandPortugalPost-demographic dividendQatarRomaniaRussian FederationSaudi ArabiaSerbiaSeychellesSingaporeSlovak RepublicSloveniaSouth AfricaSouth AsiaSouth Asia (IDA & IBRD)SpainSri LankaSt. Kitts and NevisSub-Saharan Africa Sub-Saharan Africa (excluding high income)Sub-Saharan Africa (IDA & IBRD countries)SwazilandSwedenSwitzerlandTanzaniaThailandTrinidad and TobagoTunisiaTurkeyUgandaUkraineUnited Arab EmiratesUnited KingdomUnited StatesUpper middle incomeUruguayUzbekistanVenezuela, RBVietnamWest Bank and GazaWorldZambiaZimbabwe
Linea del tempo:
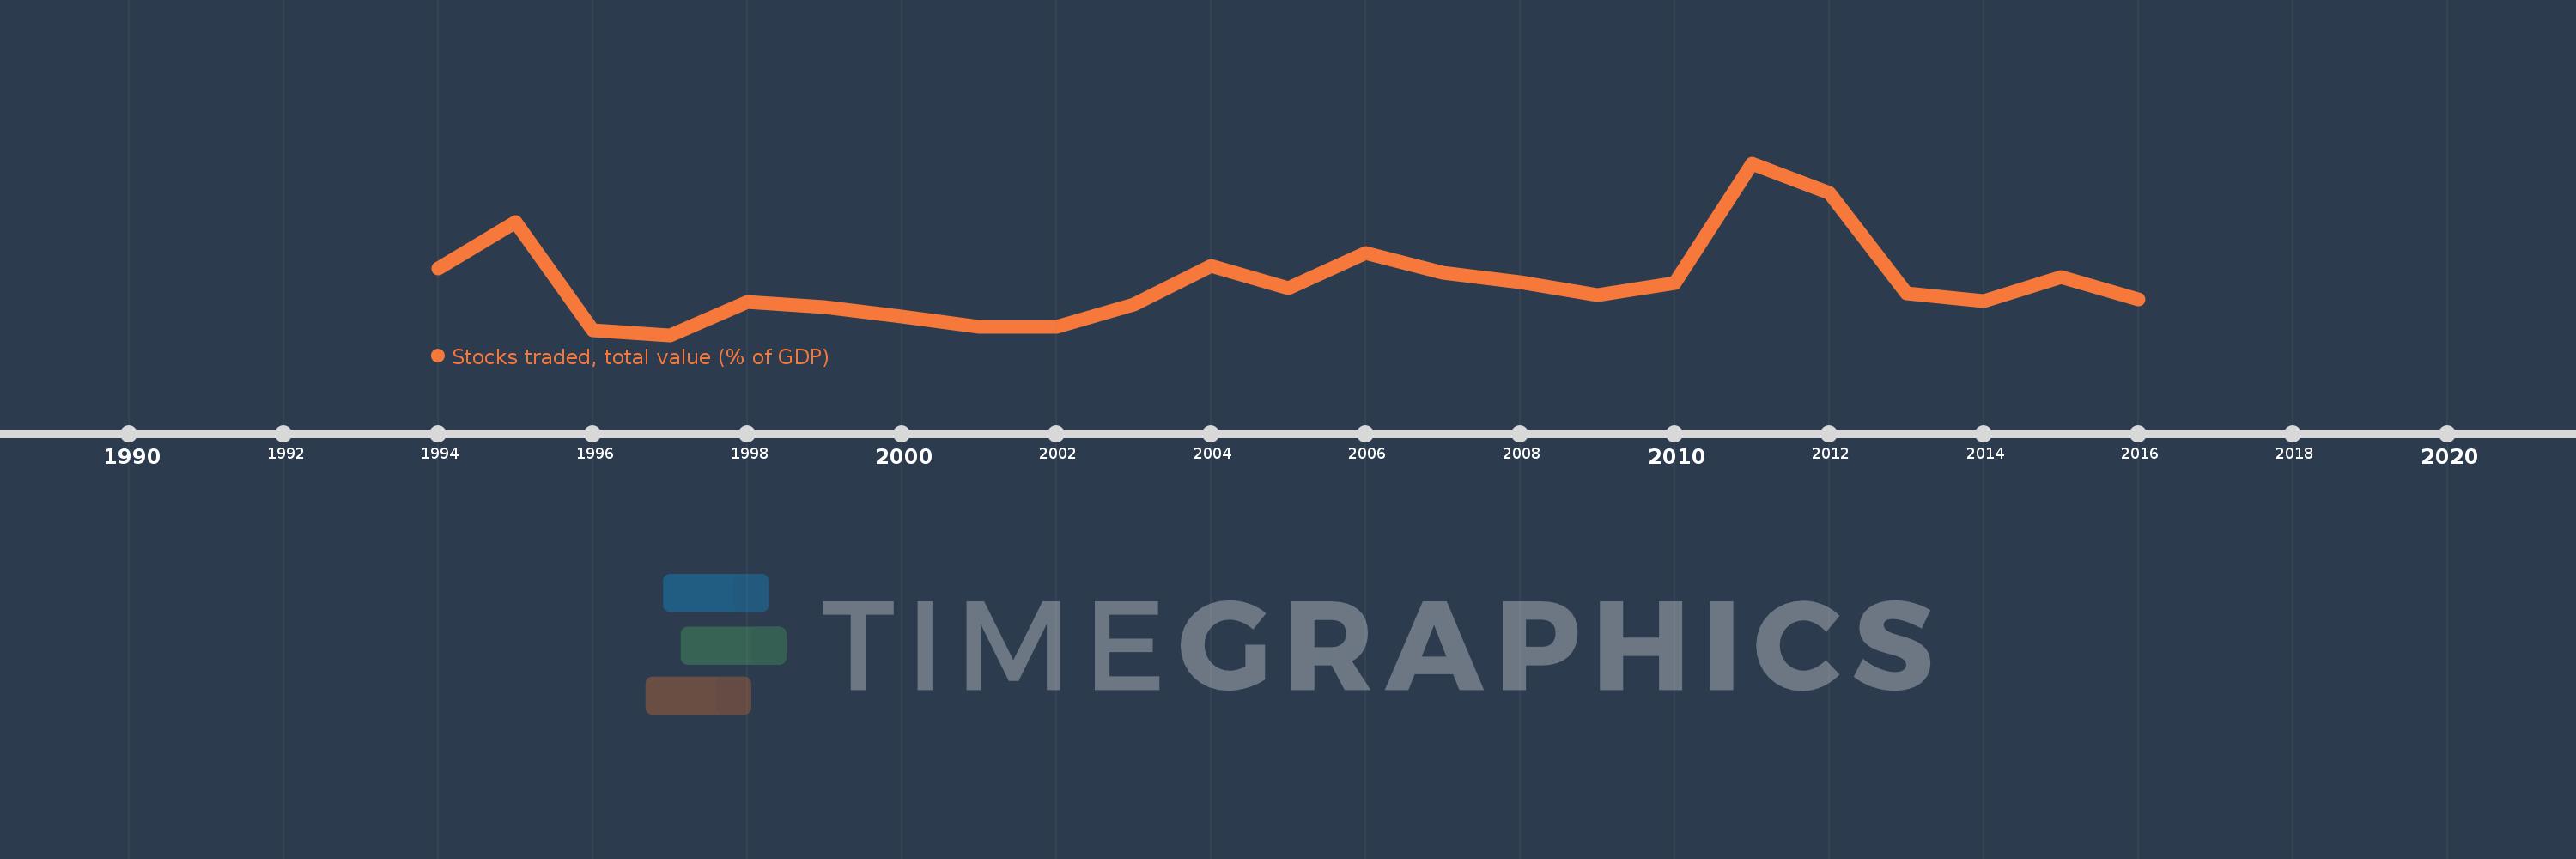
Questa scala temporale mostra un grafico dal 1994 anno al 2016 anno. Sri Lanka. I dati fino ad 1993 anno non disponibili. Il numero di osservazioni attuali secondo i date: 23.
La fonte (nome):
Indicatori dello sviluppo mondiale
La fonte (organizzazione):
World Federation of Exchanges database.
Categorie:
Financial Sector
sono stati aggiornati
23 apr 2017 anni
Indicatori delle variazioni dei valori per anni
In media:
2.965
Minima:
0.424
1 gen 1997 anni
Massimo:
8.805
1 gen 2011 anni
Alla data di osservazione
Valore
Variazione assoluta
La variazione rispetto al valore precedente
1 gen 1994 anni
3.651
+3.651
0.0%
1 gen 1995 anni
5.932
+2.281
62.46%
1 gen 1996 anni
0.655
-5.277
-88.96%
1 gen 1997 anni
0.424
-0.231
-35.26%
1 gen 1998 anni
2.049
+1.625
383.42%
1 gen 1999 anni
1.783
-0.266
-12.98%
1 gen 2000 anni
1.331
-0.451
-25.32%
1 gen 2001 anni
0.818
-0.513
-38.56%
1 gen 2002 anni
0.829
+0.011
1.32%
1 gen 2003 anni
1.908
+1.079
130.14%
1 gen 2004 anni
3.814
+1.907
99.95%
1 gen 2005 anni
2.701
-1.113
-29.19%
1 gen 2006 anni
4.425
+1.723
63.8%
1 gen 2007 anni
3.461
-0.964
-21.79%
1 gen 2008 anni
2.987
-0.474
-13.69%
1 gen 2009 anni
2.379
-0.608
-20.36%
1 gen 2010 anni
2.96
+0.582
24.45%
1 gen 2011 anni
8.805
+5.845
197.44%
1 gen 2012 anni
7.345
-1.46
-16.58%
1 gen 2013 anni
2.447
-4.898
-66.69%
1 gen 2014 anni
2.062
-0.385
-15.72%
1 gen 2015 anni
3.247
+1.185
57.45%
1 gen 2016 anni
2.179
-1.069
-32.91%
Classificazione dei paesi secondo i statistiche attuali per anni

Commenti:

Inviare
PremiumAbout & FeedbackAccordoPrivatezza
logo
© 2022 Selected Technologies LLC – Morgan Hill, California