30
/it/
AIzaSyAYiBZKx7MnpbEhh9jyipgxe19OcubqV5w
April 1, 2024
118454
Czech Republic
CZE
true
2
1
Stocks traded, total value (% of GDP)
2015,2014,2013,2012,2011,2010,2009,2008,2007,2006,2005,2004,2003,2002,2001,2000,1999,1998,1997,1996,1995,1994
Download
Biblioteca di statistiche globali →Czech Republic →

Stocks traded, total value (% of GDP)

Queste statistiche in altri paesi:

Arab WorldArgentinaArmeniaAustraliaAustriaBahrainBangladeshBarbadosBelgiumBermudaBoliviaBotswanaBrazilBulgariaCanadaCayman IslandsCentral Europe and the BalticsChannel IslandsChileChinaColombiaCosta RicaCote d'IvoireCroatiaCyprusCzech RepublicDenmarkEarly-demographic dividendEast Asia & PacificEast Asia & Pacific (excluding high income)East Asia & Pacific (IDA & IBRD countries)EcuadorEgypt, Arab Rep.El SalvadorEstoniaEuro areaEurope & Central AsiaEurope & Central Asia (excluding high income)Europe & Central Asia (IDA & IBRD countries)European UnionFijiFinlandFranceGeorgiaGermanyGhanaGreeceGuyanaHigh incomeHong Kong SAR, ChinaHungaryIBRD onlyIcelandIDA & IBRD totalIDA blendIDA totalIndiaIndonesiaIran, Islamic Rep.IrelandIsraelItalyJamaicaJapanJordanKazakhstanKenyaKorea, Rep.KuwaitKyrgyz RepublicLate-demographic dividendLatin America & Caribbean Latin America & Caribbean (excluding high income)Latin America & the Caribbean (IDA & IBRD countries)LatviaLebanonLithuaniaLow & middle incomeLower middle incomeLuxembourgMacedonia, FYRMalawiMalaysiaMaltaMauritiusMexicoMiddle East & North AfricaMiddle East & North Africa (excluding high income)Middle East & North Africa (IDA & IBRD countries)Middle incomeMoldovaMongoliaMontenegroMoroccoNamibiaNetherlandsNew ZealandNigeriaNorth AmericaNorwayOECD membersOmanOther small statesPakistanPanamaPapua New GuineaParaguayPeruPhilippinesPolandPortugalPost-demographic dividendQatarRomaniaRussian FederationSaudi ArabiaSerbiaSeychellesSingaporeSlovak RepublicSloveniaSouth AfricaSouth AsiaSouth Asia (IDA & IBRD)SpainSri LankaSt. Kitts and NevisSub-Saharan Africa Sub-Saharan Africa (excluding high income)Sub-Saharan Africa (IDA & IBRD countries)SwazilandSwedenSwitzerlandTanzaniaThailandTrinidad and TobagoTunisiaTurkeyUgandaUkraineUnited Arab EmiratesUnited KingdomUnited StatesUpper middle incomeUruguayUzbekistanVenezuela, RBVietnamWest Bank and GazaWorldZambiaZimbabwe

Linea del tempo:

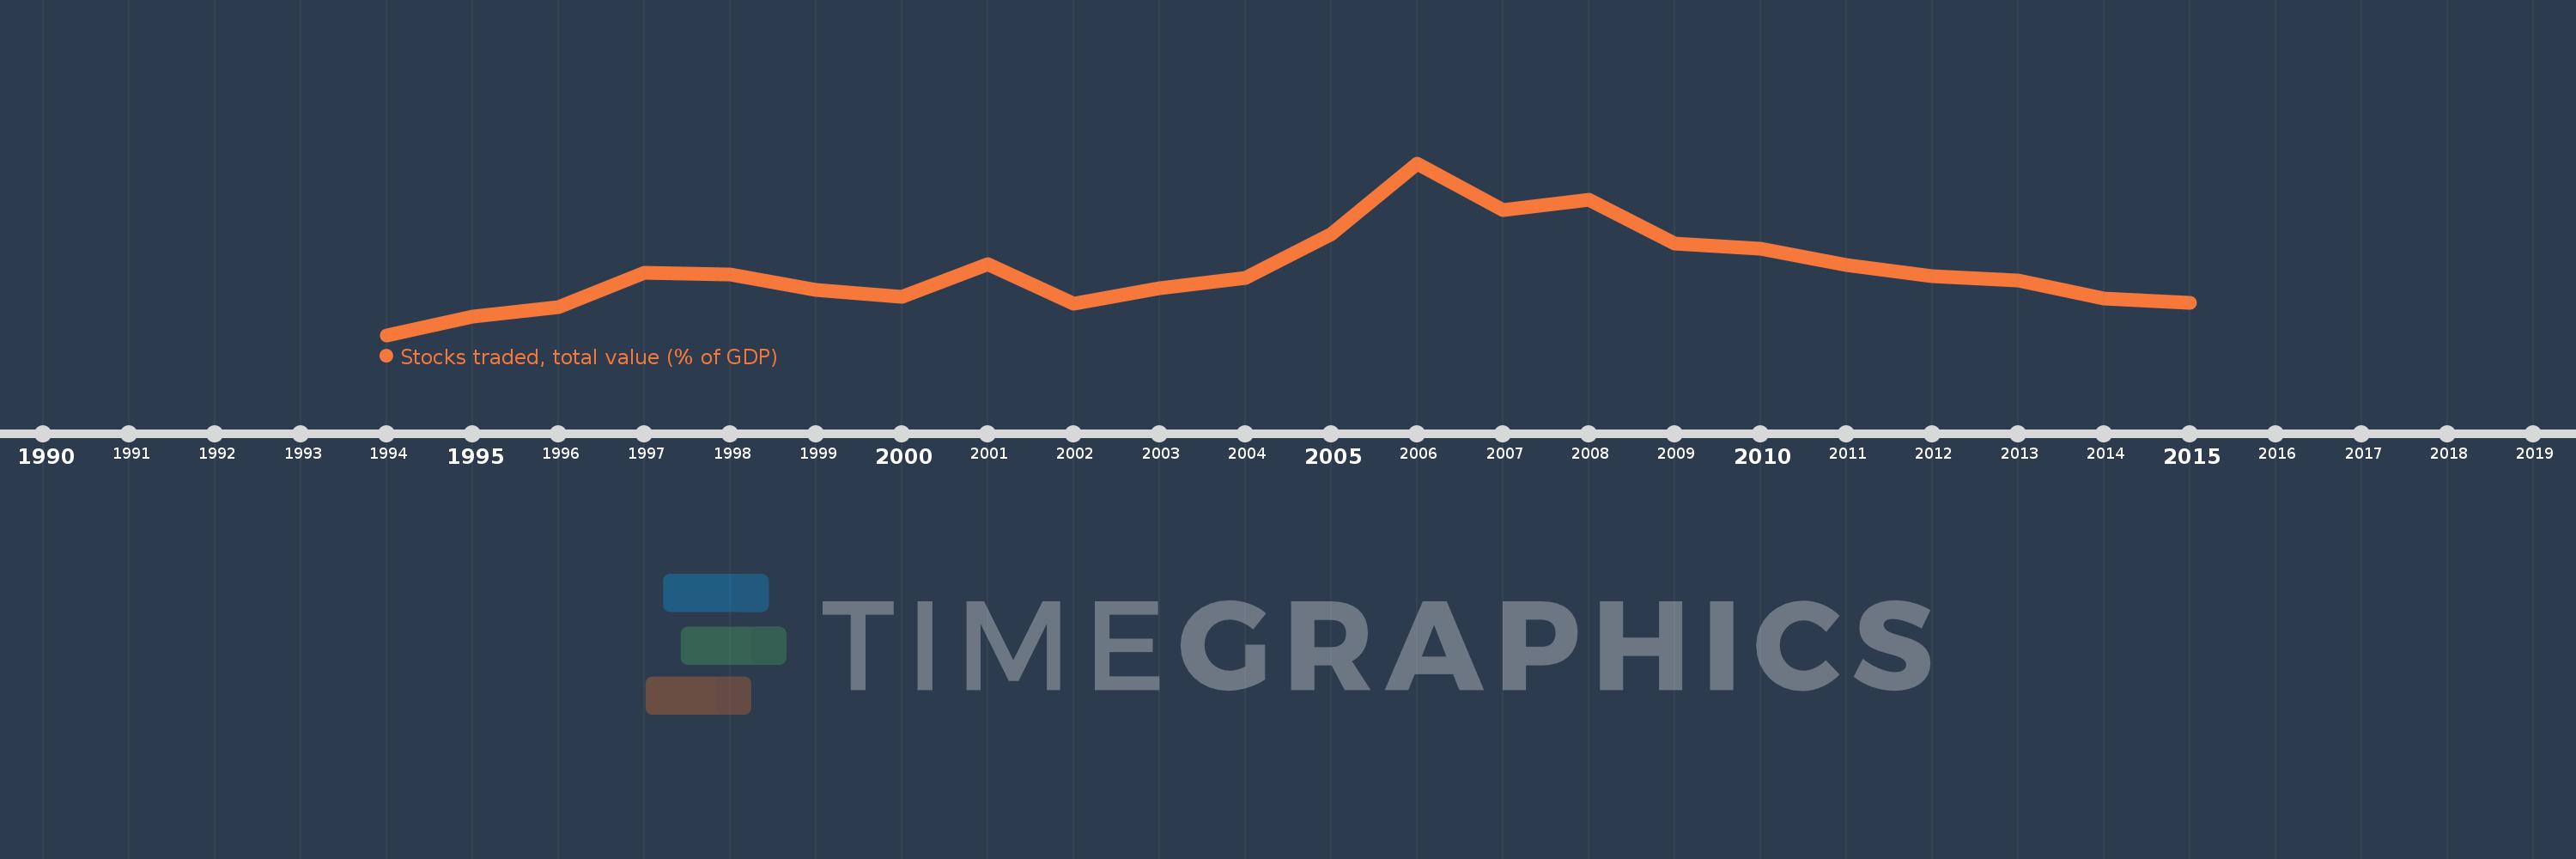
Questa scala temporale mostra un grafico dal 1994 anno al 2015 anno. Czech Republic. I dati fino ad 1993 anno non disponibili. Il numero di osservazioni attuali secondo i date: 22.

La fonte (nome):

Indicatori dello sviluppo mondiale

La fonte (organizzazione):

World Federation of Exchanges database.

Categorie:

Financial Sector

sono stati aggiornati

23 apr 2017 anni

Indicatori delle variazioni dei valori per anni

In media:
9.873
Minima:
0.587
1 gen 1994 anni
Massimo:
25.252
1 gen 2006 anni
Alla data di osservazione
Valore
Variazione assoluta
La variazione rispetto al valore precedente
1 gen 1994 anni
0.587
+0.587
0.0%
1 gen 1995 anni
3.225
+2.637
449.22%
1 gen 1996 anni
4.61
+1.386
42.98%
1 gen 1997 anni
9.479
+4.869
105.6%
1 gen 1998 anni
9.27
-0.209
-2.2%
1 gen 1999 anni
7.12
-2.15
-23.19%
1 gen 2000 anni
6.078
-1.042
-14.63%
1 gen 2001 anni
10.818
+4.739
77.97%
1 gen 2002 anni
5.118
-5.7
-52.69%
1 gen 2003 anni
7.249
+2.131
41.65%
1 gen 2004 anni
8.83
+1.581
21.81%
1 gen 2005 anni
15.137
+6.307
71.43%
1 gen 2006 anni
25.252
+10.115
66.82%
1 gen 2007 anni
18.541
-6.711
-26.57%
1 gen 2008 anni
20.013
+1.472
7.94%
1 gen 2009 anni
13.725
-6.289
-31.42%
1 gen 2010 anni
12.948
-0.777
-5.66%
1 gen 2011 anni
10.664
-2.283
-17.63%
1 gen 2012 anni
9.041
-1.624
-15.23%
1 gen 2013 anni
8.456
-0.585
-6.47%
1 gen 2014 anni
5.859
-2.597
-30.71%
1 gen 2015 anni
5.186
-0.673
-11.49%

Classificazione dei paesi secondo i statistiche attuali per anni