33
/it/
AIzaSyAYiBZKx7MnpbEhh9jyipgxe19OcubqV5w
August 1, 2025
222944
Peru
PER
true
2
1
Stocks traded, total value (% of GDP)
2016,2015,2014,2013,2012,2011,2010,2009,2008,2007,2006,2005,2004,2003,2002,2001,2000,1999,1998,1997,1996,1995,1994
Download
Biblioteca di statistiche globali →Peru →

Stocks traded, total value (% of GDP)

Queste statistiche in altri paesi:

Arab WorldArgentinaArmeniaAustraliaAustriaBahrainBangladeshBarbadosBelgiumBermudaBoliviaBotswanaBrazilBulgariaCanadaCayman IslandsCentral Europe and the BalticsChannel IslandsChileChinaColombiaCosta RicaCote d'IvoireCroatiaCyprusCzech RepublicDenmarkEarly-demographic dividendEast Asia & PacificEast Asia & Pacific (excluding high income)East Asia & Pacific (IDA & IBRD countries)EcuadorEgypt, Arab Rep.El SalvadorEstoniaEuro areaEurope & Central AsiaEurope & Central Asia (excluding high income)Europe & Central Asia (IDA & IBRD countries)European UnionFijiFinlandFranceGeorgiaGermanyGhanaGreeceGuyanaHigh incomeHong Kong SAR, ChinaHungaryIBRD onlyIcelandIDA & IBRD totalIDA blendIDA totalIndiaIndonesiaIran, Islamic Rep.IrelandIsraelItalyJamaicaJapanJordanKazakhstanKenyaKorea, Rep.KuwaitKyrgyz RepublicLate-demographic dividendLatin America & Caribbean Latin America & Caribbean (excluding high income)Latin America & the Caribbean (IDA & IBRD countries)LatviaLebanonLithuaniaLow & middle incomeLower middle incomeLuxembourgMacedonia, FYRMalawiMalaysiaMaltaMauritiusMexicoMiddle East & North AfricaMiddle East & North Africa (excluding high income)Middle East & North Africa (IDA & IBRD countries)Middle incomeMoldovaMongoliaMontenegroMoroccoNamibiaNetherlandsNew ZealandNigeriaNorth AmericaNorwayOECD membersOmanOther small statesPakistanPanamaPapua New GuineaParaguayPeruPhilippinesPolandPortugalPost-demographic dividendQatarRomaniaRussian FederationSaudi ArabiaSerbiaSeychellesSingaporeSlovak RepublicSloveniaSouth AfricaSouth AsiaSouth Asia (IDA & IBRD)SpainSri LankaSt. Kitts and NevisSub-Saharan Africa Sub-Saharan Africa (excluding high income)Sub-Saharan Africa (IDA & IBRD countries)SwazilandSwedenSwitzerlandTanzaniaThailandTrinidad and TobagoTunisiaTurkeyUgandaUkraineUnited Arab EmiratesUnited KingdomUnited StatesUpper middle incomeUruguayUzbekistanVenezuela, RBVietnamWest Bank and GazaWorldZambiaZimbabwe

Linea del tempo:

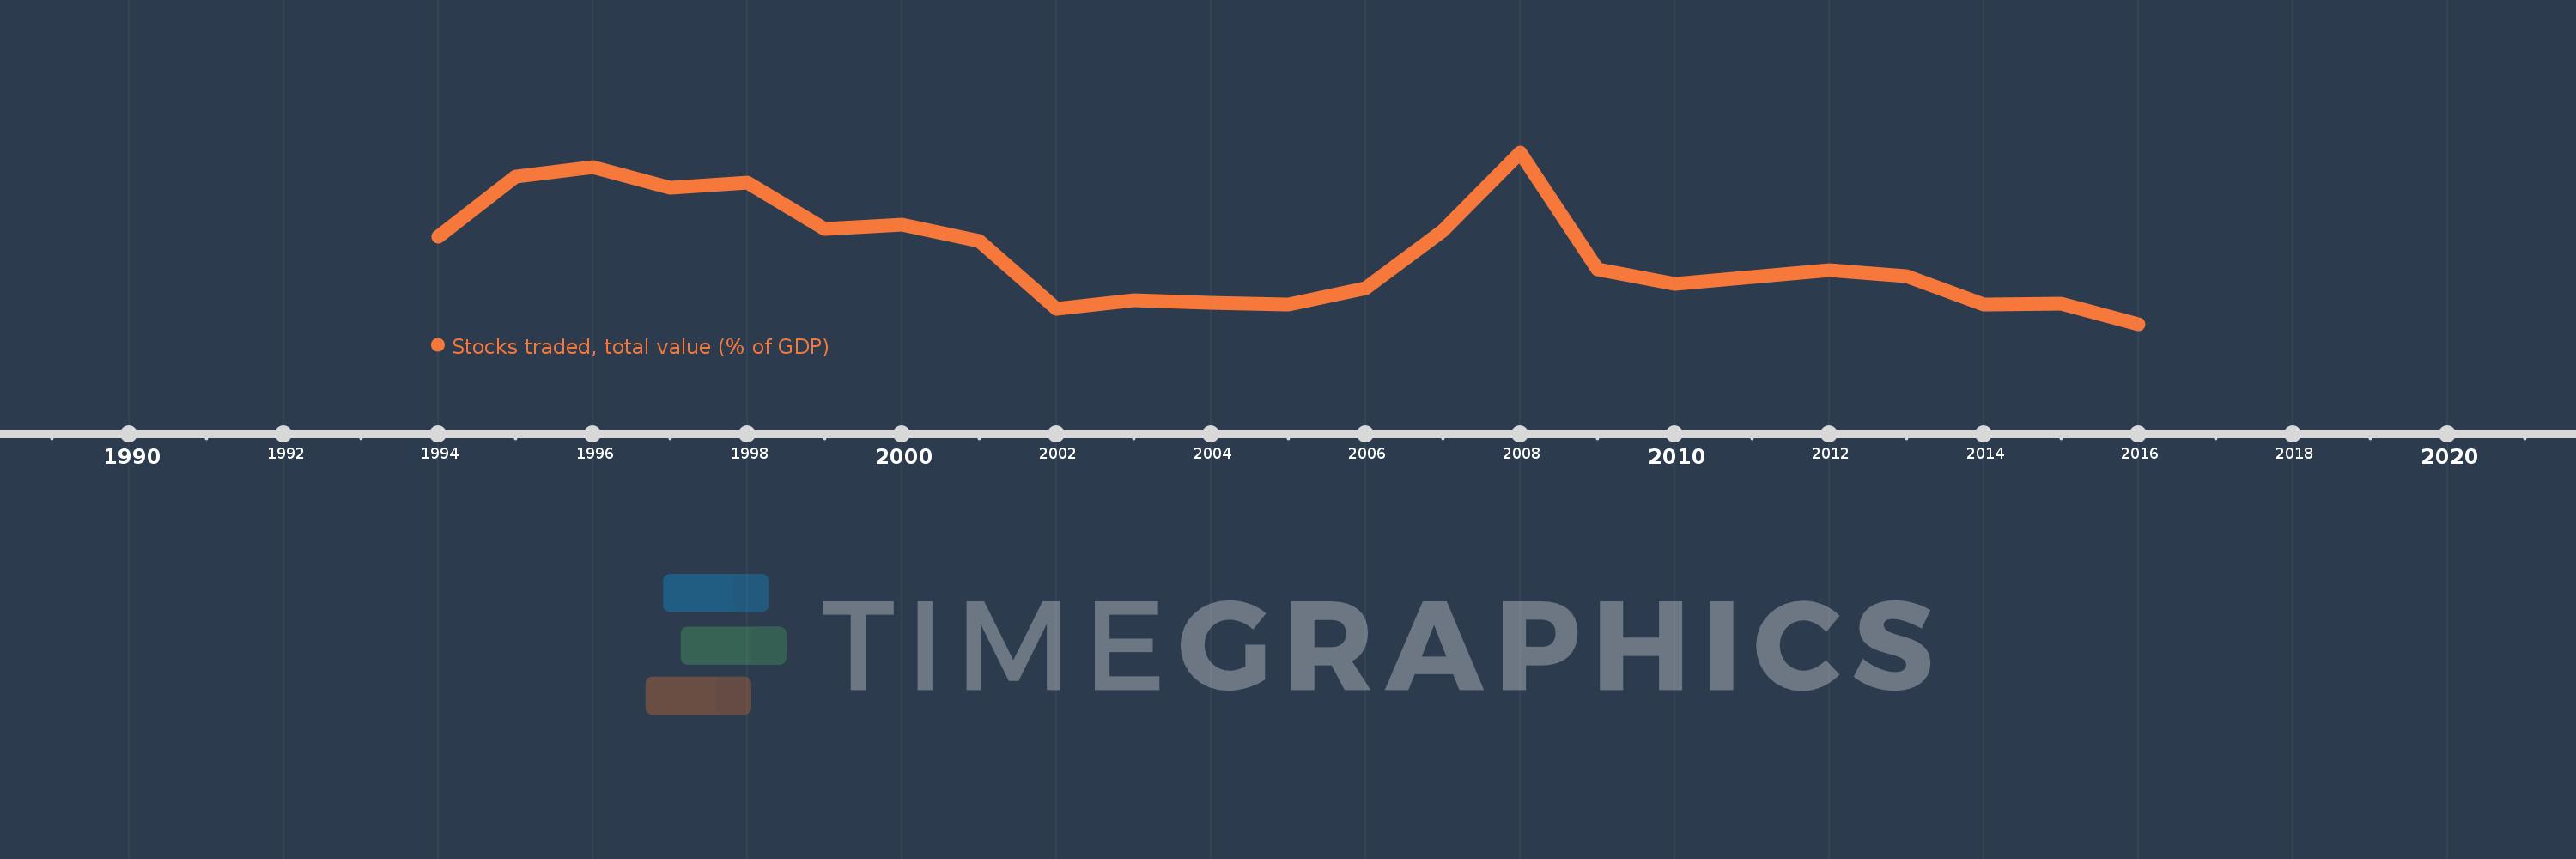
Questa scala temporale mostra un grafico dal 1994 anno al 2016 anno. Peru. I dati fino ad 1993 anno non disponibili. Il numero di osservazioni attuali secondo i date: 23.

La fonte (nome):

Indicatori dello sviluppo mondiale

La fonte (organizzazione):

World Federation of Exchanges database.

Categorie:

Financial Sector

sono stati aggiornati

23 apr 2017 anni

Indicatori delle variazioni dei valori per anni

In media:
3.679
Minima:
0.767
1 gen 2016 anni
Massimo:
7.89
1 gen 2008 anni
Alla data di osservazione
Valore
Variazione assoluta
La variazione rispetto al valore precedente
1 gen 1994 anni
4.402
+4.402
0.0%
1 gen 1995 anni
6.888
+2.486
56.49%
1 gen 1996 anni
7.287
+0.399
5.79%
1 gen 1997 anni
6.432
-0.854
-11.72%
1 gen 1998 anni
6.634
+0.202
3.14%
1 gen 1999 anni
4.734
-1.9
-28.64%
1 gen 2000 anni
4.892
+0.158
3.33%
1 gen 2001 anni
4.234
-0.658
-13.45%
1 gen 2002 anni
1.415
-2.819
-66.58%
1 gen 2003 anni
1.752
+0.337
23.84%
1 gen 2004 anni
1.65
-0.102
-5.82%
1 gen 2005 anni
1.583
-0.067
-4.05%
1 gen 2006 anni
2.256
+0.673
42.48%
1 gen 2007 anni
4.662
+2.406
106.64%
1 gen 2008 anni
7.89
+3.228
69.24%
1 gen 2009 anni
3.054
-4.836
-61.3%
1 gen 2010 anni
2.449
-0.605
-19.8%
1 gen 2011 anni
2.708
+0.259
10.56%
1 gen 2012 anni
3.014
+0.307
11.33%
1 gen 2013 anni
2.741
-0.273
-9.07%
1 gen 2014 anni
1.577
-1.163
-42.44%
1 gen 2015 anni
1.606
+0.028
1.79%
1 gen 2016 anni
0.767
-0.838
-52.21%

Classificazione dei paesi secondo i statistiche attuali per anni