33
/it/
AIzaSyAYiBZKx7MnpbEhh9jyipgxe19OcubqV5w
August 1, 2025
286618
Zambia
ZMB
true
2
1
Stocks traded, total value (% of GDP)
2013,2012,2011,2007,2006,2005,2004,2003,2002,2001,2000,1999,1998,1997,1996,1995
Download
Biblioteca di statistiche globali →Zambia →

Stocks traded, total value (% of GDP)

Queste statistiche in altri paesi:

Arab WorldArgentinaArmeniaAustraliaAustriaBahrainBangladeshBarbadosBelgiumBermudaBoliviaBotswanaBrazilBulgariaCanadaCayman IslandsCentral Europe and the BalticsChannel IslandsChileChinaColombiaCosta RicaCote d'IvoireCroatiaCyprusCzech RepublicDenmarkEarly-demographic dividendEast Asia & PacificEast Asia & Pacific (excluding high income)East Asia & Pacific (IDA & IBRD countries)EcuadorEgypt, Arab Rep.El SalvadorEstoniaEuro areaEurope & Central AsiaEurope & Central Asia (excluding high income)Europe & Central Asia (IDA & IBRD countries)European UnionFijiFinlandFranceGeorgiaGermanyGhanaGreeceGuyanaHigh incomeHong Kong SAR, ChinaHungaryIBRD onlyIcelandIDA & IBRD totalIDA blendIDA totalIndiaIndonesiaIran, Islamic Rep.IrelandIsraelItalyJamaicaJapanJordanKazakhstanKenyaKorea, Rep.KuwaitKyrgyz RepublicLate-demographic dividendLatin America & Caribbean Latin America & Caribbean (excluding high income)Latin America & the Caribbean (IDA & IBRD countries)LatviaLebanonLithuaniaLow & middle incomeLower middle incomeLuxembourgMacedonia, FYRMalawiMalaysiaMaltaMauritiusMexicoMiddle East & North AfricaMiddle East & North Africa (excluding high income)Middle East & North Africa (IDA & IBRD countries)Middle incomeMoldovaMongoliaMontenegroMoroccoNamibiaNetherlandsNew ZealandNigeriaNorth AmericaNorwayOECD membersOmanOther small statesPakistanPanamaPapua New GuineaParaguayPeruPhilippinesPolandPortugalPost-demographic dividendQatarRomaniaRussian FederationSaudi ArabiaSerbiaSeychellesSingaporeSlovak RepublicSloveniaSouth AfricaSouth AsiaSouth Asia (IDA & IBRD)SpainSri LankaSt. Kitts and NevisSub-Saharan Africa Sub-Saharan Africa (excluding high income)Sub-Saharan Africa (IDA & IBRD countries)SwazilandSwedenSwitzerlandTanzaniaThailandTrinidad and TobagoTunisiaTurkeyUgandaUkraineUnited Arab EmiratesUnited KingdomUnited StatesUpper middle incomeUruguayUzbekistanVenezuela, RBVietnamWest Bank and GazaWorldZambiaZimbabwe

Linea del tempo:

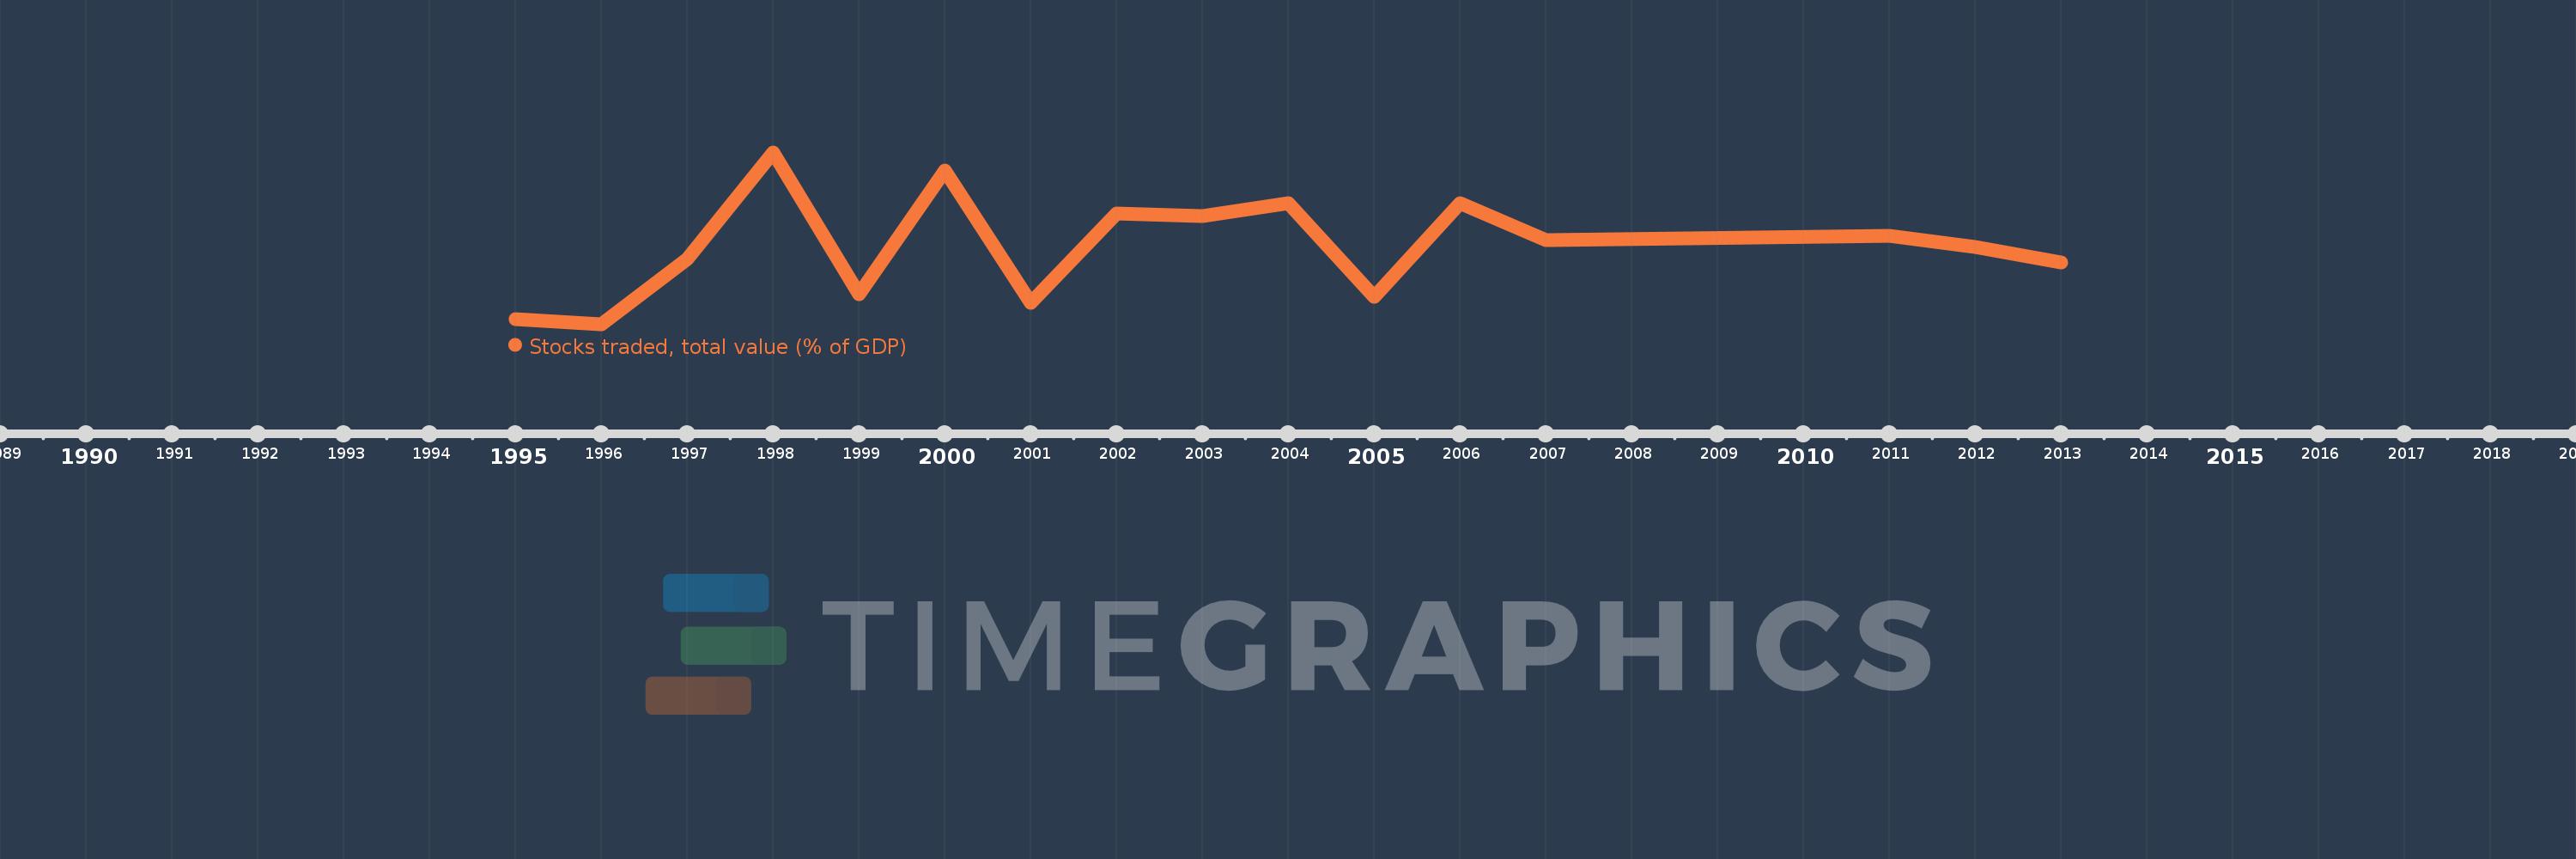
Questa scala temporale mostra un grafico dal 1995 anno al 2013 anno. Zambia. I dati fino ad 1994 anno non disponibili. Il numero di osservazioni attuali secondo i date: 16.

La fonte (nome):

Indicatori dello sviluppo mondiale

La fonte (organizzazione):

World Federation of Exchanges database.

Categorie:

Financial Sector

sono stati aggiornati

23 apr 2017 anni

Indicatori delle variazioni dei valori per anni

In media:
0.088
Minima:
0.006
1 gen 1996 anni
Massimo:
0.186
1 gen 1998 anni
Alla data di osservazione
Valore
Variazione assoluta
La variazione rispetto al valore precedente
1 gen 1995 anni
0.011
+0.011
0.0%
1 gen 1996 anni
0.006
-0.005
-47.17%
1 gen 1997 anni
0.074
+0.068
1.18 Mille.%
1 gen 1998 anni
0.186
+0.112
151.41%
1 gen 1999 anni
0.037
-0.149
-80.08%
1 gen 2000 anni
0.167
+0.13
351.37%
1 gen 2001 anni
0.028
-0.139
-83.38%
1 gen 2002 anni
0.122
+0.094
339.7%
1 gen 2003 anni
0.119
-0.003
-2.37%
1 gen 2004 anni
0.133
+0.014
11.57%
1 gen 2005 anni
0.035
-0.098
-73.53%
1 gen 2006 anni
0.133
+0.098
278.44%
1 gen 2007 anni
0.094
-0.039
-29.16%
1 gen 2011 anni
0.099
+0.004
4.72%
1 gen 2012 anni
0.087
-0.011
-11.59%
1 gen 2013 anni
0.071
-0.016
-18.33%

Classificazione dei paesi secondo i statistiche attuali per anni