29
/fr/
fr
AIzaSyAYiBZKx7MnpbEhh9jyipgxe19OcubqV5w
April 1, 2024
87269
Bolivia
BOL
true
2
1
Grants and other revenue (current LCU)
2008,2007,2006,2005,2004,2003,2002,2001,2000,1999,1998,1997,1996,1995,1994,1993,1992,1991,1990,1989,1988,1987,1986
Download
Bibliothèque de statistiques globales →Bolivia →

Grants and other revenue (current LCU)

Cette statistique dans les autres pays:
AfghanistanAlbaniaAlgeriaAngolaAntigua and BarbudaArgentinaArmeniaAustraliaAustriaAzerbaijanBahamas, TheBahrainBangladeshBarbadosBelarusBelgiumBelizeBeninBhutanBoliviaBosnia and HerzegovinaBotswanaBrazilBulgariaBurkina FasoBurundiCabo VerdeCambodiaCanadaCentral African RepublicChileChinaColombiaCongo, Dem. Rep.Congo, Rep.Costa RicaCote d'IvoireCroatiaCyprusCzech RepublicDenmarkDominicaDominican RepublicEgypt, Arab Rep.El SalvadorEquatorial GuineaEstoniaEthiopiaFijiFinlandFranceGambia, TheGeorgiaGermanyGhanaGreeceGrenadaGuatemalaHondurasHong Kong SAR, ChinaHungaryIcelandIndiaIndonesiaIran, Islamic Rep.IraqIrelandIsraelItalyJamaicaJapanJordanKazakhstanKenyaKiribatiKorea, Rep.KuwaitKyrgyz RepublicLao PDRLatviaLebanonLesothoLiberiaLithuaniaLuxembourgMacao SAR, ChinaMacedonia, FYRMadagascarMalawiMalaysiaMaldivesMaliMaltaMauritiusMexicoMicronesia, Fed. Sts.MoldovaMongoliaMoroccoMozambiqueMyanmarNamibiaNepalNetherlandsNew ZealandNicaraguaNigeriaNorwayOmanPakistanPanamaPapua New GuineaParaguayPeruPhilippinesPolandPortugalQatarRomaniaRussian FederationRwandaSamoaSan MarinoSao Tome and PrincipeSenegalSerbiaSeychellesSierra LeoneSingaporeSlovak RepublicSloveniaSolomon IslandsSouth AfricaSpainSri LankaSt. Kitts and NevisSt. LuciaSt. Vincent and the GrenadinesSurinameSwazilandSwedenSwitzerlandSyrian Arab RepublicTajikistanTanzaniaThailandTimor-LesteTogoTrinidad and TobagoTunisiaTurkeyUgandaUkraineUnited Arab EmiratesUnited KingdomUnited StatesUruguayVanuatuVenezuela, RBVietnamWest Bank and GazaYemen, Rep.ZambiaZimbabwe
La ligne de temps
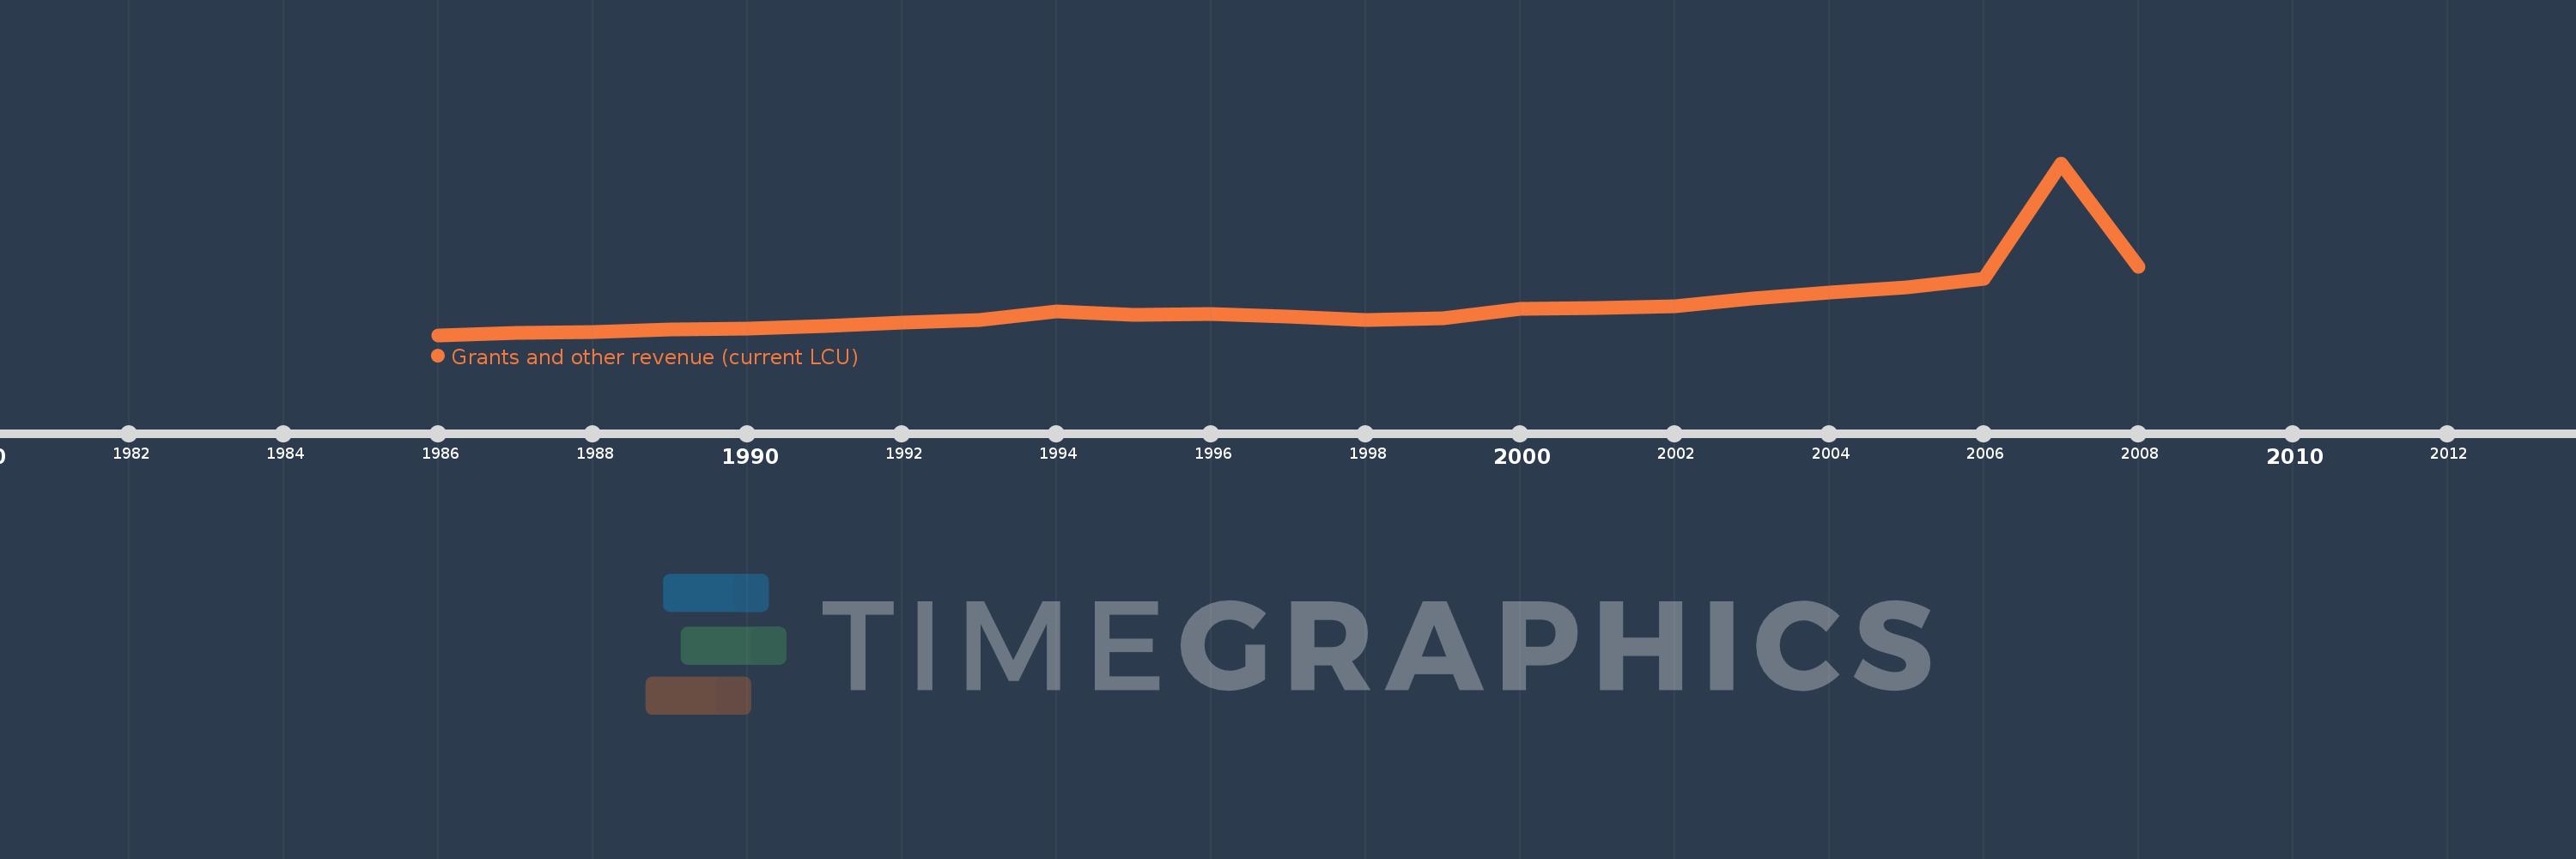
Cette échelle de temps montre un graphique de 1986 année à 2008 année Bolivia. Les données jusqu'à 1985 année ne sont pas présentés. Quantité d'observations actuelles selon dates: 23.
Source (désignation):
Les indicateurs du développement mondiale
Source (organisation):
International Monetary Fund, Government Finance Statistics Yearbook and data files.
Catégories:
Public Sector
Dernière mise à jour
23 avr. 2017
Les indicateurs de changement de valeurs selon les années
En moyenne:
3.194 mds
Minimum:
14.7 mln.
1 janv. 1986
Maximum:
18.62 mds
1 janv. 2007
Pour la date d''observation
Valeur
Changement absolu
Le changement par rapport à la valeur précédente
1 janv. 1986
14.7 mln.
+14.7 mln.
0.0%
1 janv. 1987
263.1 mln.
+248.4 mln.
1.69 milles%
1 janv. 1988
358.0 mln.
+94.9 mln.
36.07%
1 janv. 1989
622.3 mln.
+264.3 mln.
73.83%
1 janv. 1990
711.2 mln.
+88.9 mln.
14.29%
1 janv. 1991
971.2 mln.
+260.0 mln.
36.56%
1 janv. 1992
1.375 mds
+404.2 mln.
41.62%
1 janv. 1993
1.605 mds
+229.2 mln.
16.66%
1 janv. 1994
2.586 mds
+981.2 mln.
61.15%
1 janv. 1995
2.232 mds
-354.0 mln.
-13.69%
1 janv. 1996
2.283 mds
+51.3 mln.
2.3%
1 janv. 1997
2.053 mds
-229.8 mln.
-10.07%
1 janv. 1998
1.621 mds
-432.8 mln.
-21.08%
1 janv. 1999
1.87 mds
+249.4 mln.
15.39%
1 janv. 2000
2.853 mds
+982.6 mln.
52.55%
1 janv. 2001
2.928 mds
+75.5 mln.
2.65%
1 janv. 2002
3.158 mds
+229.98 mln.
7.85%
1 janv. 2003
3.959 mds
+800.587 mln.
25.35%
1 janv. 2004
4.661 mds
+702.378 mln.
17.74%
1 janv. 2005
5.214 mds
+552.855 mln.
11.86%
1 janv. 2006
6.07 mds
+856.557 mln.
16.43%
1 janv. 2007
18.62 mds
+12.549 mds
206.73%
1 janv. 2008
7.442 mds
-11.177 mds
-60.03%
Classement des pays selon les statistiques actuelles par années

Commentaires:

Envoyer
PremiumAbout & FeedbackUn accordConfidentialité
logo
© 2022 Selected Technologies LLC – Morgan Hill, California