29
/fr/
fr
AIzaSyAYiBZKx7MnpbEhh9jyipgxe19OcubqV5w
April 1, 2024
287247
Zimbabwe
ZWE
true
2
1
Grants and other revenue (current LCU)
1998,1997,1996,1995,1994,1993,1992,1991,1990,1989,1988,1987,1986,1985,1984,1983,1982,1981,1980,1979,1978,1977
Download
Bibliothèque de statistiques globales →Zimbabwe →

Grants and other revenue (current LCU)

Cette statistique dans les autres pays:
AfghanistanAlbaniaAlgeriaAngolaAntigua and BarbudaArgentinaArmeniaAustraliaAustriaAzerbaijanBahamas, TheBahrainBangladeshBarbadosBelarusBelgiumBelizeBeninBhutanBoliviaBosnia and HerzegovinaBotswanaBrazilBulgariaBurkina FasoBurundiCabo VerdeCambodiaCanadaCentral African RepublicChileChinaColombiaCongo, Dem. Rep.Congo, Rep.Costa RicaCote d'IvoireCroatiaCyprusCzech RepublicDenmarkDominicaDominican RepublicEgypt, Arab Rep.El SalvadorEquatorial GuineaEstoniaEthiopiaFijiFinlandFranceGambia, TheGeorgiaGermanyGhanaGreeceGrenadaGuatemalaHondurasHong Kong SAR, ChinaHungaryIcelandIndiaIndonesiaIran, Islamic Rep.IraqIrelandIsraelItalyJamaicaJapanJordanKazakhstanKenyaKiribatiKorea, Rep.KuwaitKyrgyz RepublicLao PDRLatviaLebanonLesothoLiberiaLithuaniaLuxembourgMacao SAR, ChinaMacedonia, FYRMadagascarMalawiMalaysiaMaldivesMaliMaltaMauritiusMexicoMicronesia, Fed. Sts.MoldovaMongoliaMoroccoMozambiqueMyanmarNamibiaNepalNetherlandsNew ZealandNicaraguaNigeriaNorwayOmanPakistanPanamaPapua New GuineaParaguayPeruPhilippinesPolandPortugalQatarRomaniaRussian FederationRwandaSamoaSan MarinoSao Tome and PrincipeSenegalSerbiaSeychellesSierra LeoneSingaporeSlovak RepublicSloveniaSolomon IslandsSouth AfricaSpainSri LankaSt. Kitts and NevisSt. LuciaSt. Vincent and the GrenadinesSurinameSwazilandSwedenSwitzerlandSyrian Arab RepublicTajikistanTanzaniaThailandTimor-LesteTogoTrinidad and TobagoTunisiaTurkeyUgandaUkraineUnited Arab EmiratesUnited KingdomUnited StatesUruguayVanuatuVenezuela, RBVietnamWest Bank and GazaYemen, Rep.ZambiaZimbabwe
La ligne de temps
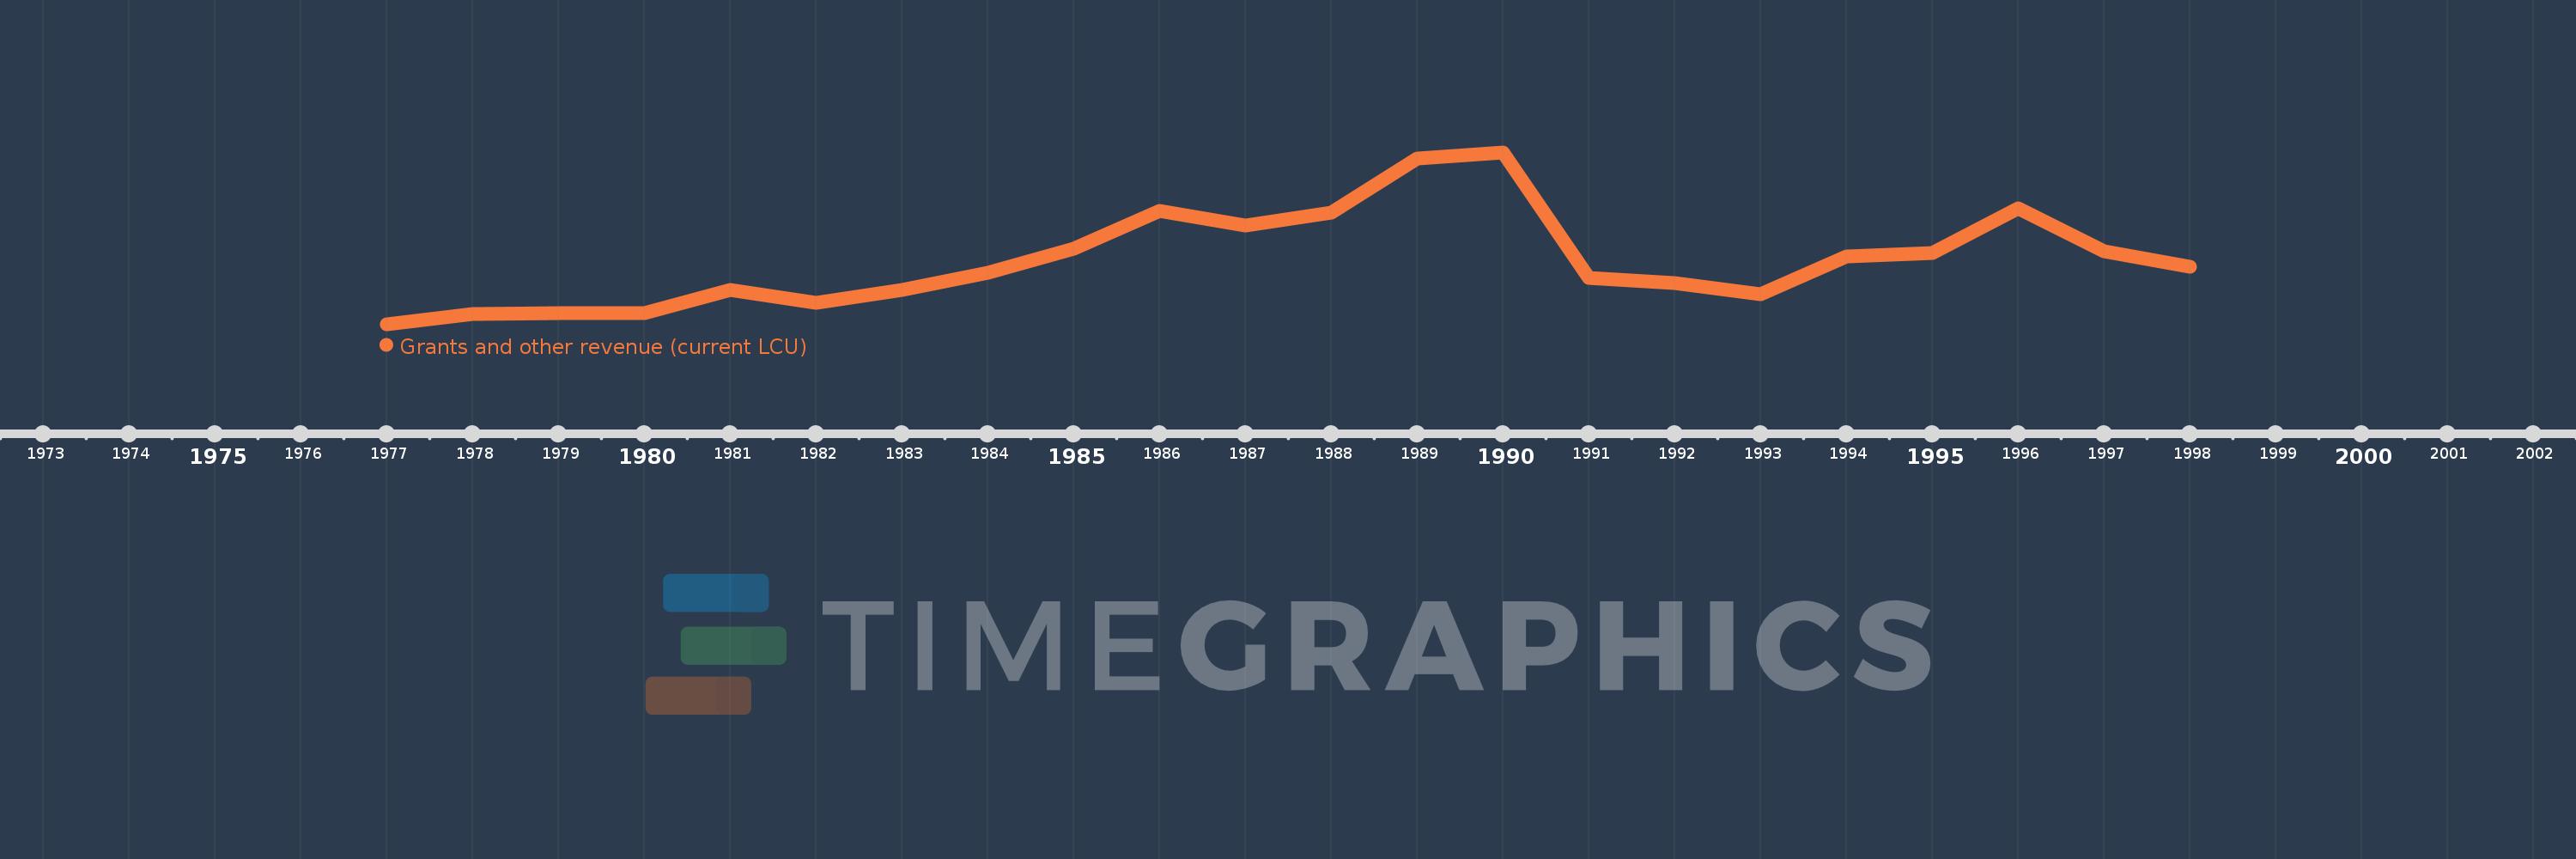
Cette échelle de temps montre un graphique de 1977 année à 1998 année Zimbabwe. Les données jusqu'à 1976 année ne sont pas présentés. Quantité d'observations actuelles selon dates: 22.
Source (désignation):
Les indicateurs du développement mondiale
Source (organisation):
International Monetary Fund, Government Finance Statistics Yearbook and data files.
Catégories:
Public Sector
Dernière mise à jour
23 avr. 2017
Les indicateurs de changement de valeurs selon les années
En moyenne:
249.74 mln.
Minimum:
73.3 mln.
1 janv. 1977
Maximum:
545.3 mln.
1 janv. 1990
Pour la date d''observation
Valeur
Changement absolu
Le changement par rapport à la valeur précédente
1 janv. 1977
73.3 mln.
+73.3 mln.
0.0%
1 janv. 1978
101.9 mln.
+28.6 mln.
39.02%
1 janv. 1979
103.4 mln.
+1.5 mln.
1.47%
1 janv. 1980
104.4 mln.
+1000.0 milles
0.97%
1 janv. 1981
167.6 mln.
+63.2 mln.
60.54%
1 janv. 1982
130.9 mln.
-36.7 mln.
-21.9%
1 janv. 1983
166.7 mln.
+35.8 mln.
27.35%
1 janv. 1984
215.0 mln.
+48.3 mln.
28.97%
1 janv. 1985
281.7 mln.
+66.7 mln.
31.02%
1 janv. 1986
384.5 mln.
+102.8 mln.
36.49%
1 janv. 1987
343.4 mln.
-41.1 mln.
-10.69%
1 janv. 1988
381.0 mln.
+37.6 mln.
10.95%
1 janv. 1989
529.2 mln.
+148.2 mln.
38.9%
1 janv. 1990
545.3 mln.
+16.1 mln.
3.04%
1 janv. 1991
199.51 mln.
-345.79 mln.
-63.41%
1 janv. 1992
186.26 mln.
-13.249 mln.
-6.64%
1 janv. 1993
154.908 mln.
-31.352 mln.
-16.83%
1 janv. 1994
260.306 mln.
+105.398 mln.
68.04%
1 janv. 1995
268.16 mln.
+7.854 mln.
3.02%
1 janv. 1996
392.734 mln.
+124.575 mln.
46.46%
1 janv. 1997
273.994 mln.
-118.74 mln.
-30.23%
1 janv. 1998
230.111 mln.
-43.884 mln.
-16.02%
Classement des pays selon les statistiques actuelles par années

Commentaires:

Envoyer
PremiumAbout & FeedbackUn accordConfidentialité
logo
© 2022 Selected Technologies LLC – Morgan Hill, California