29
/fr/
fr
AIzaSyAYiBZKx7MnpbEhh9jyipgxe19OcubqV5w
April 1, 2024
150414
Honduras
HND
true
2
1
Grants and other revenue (current LCU)
2016,2015,2014,2013,2012,2011,2010,2009,2008,2007,2006,2005,2004,1982,1981,1980,1979,1978,1977,1976,1975,1974,1973
Download
Bibliothèque de statistiques globales →Honduras →

Grants and other revenue (current LCU)

Cette statistique dans les autres pays:
AfghanistanAlbaniaAlgeriaAngolaAntigua and BarbudaArgentinaArmeniaAustraliaAustriaAzerbaijanBahamas, TheBahrainBangladeshBarbadosBelarusBelgiumBelizeBeninBhutanBoliviaBosnia and HerzegovinaBotswanaBrazilBulgariaBurkina FasoBurundiCabo VerdeCambodiaCanadaCentral African RepublicChileChinaColombiaCongo, Dem. Rep.Congo, Rep.Costa RicaCote d'IvoireCroatiaCyprusCzech RepublicDenmarkDominicaDominican RepublicEgypt, Arab Rep.El SalvadorEquatorial GuineaEstoniaEthiopiaFijiFinlandFranceGambia, TheGeorgiaGermanyGhanaGreeceGrenadaGuatemalaHondurasHong Kong SAR, ChinaHungaryIcelandIndiaIndonesiaIran, Islamic Rep.IraqIrelandIsraelItalyJamaicaJapanJordanKazakhstanKenyaKiribatiKorea, Rep.KuwaitKyrgyz RepublicLao PDRLatviaLebanonLesothoLiberiaLithuaniaLuxembourgMacao SAR, ChinaMacedonia, FYRMadagascarMalawiMalaysiaMaldivesMaliMaltaMauritiusMexicoMicronesia, Fed. Sts.MoldovaMongoliaMoroccoMozambiqueMyanmarNamibiaNepalNetherlandsNew ZealandNicaraguaNigeriaNorwayOmanPakistanPanamaPapua New GuineaParaguayPeruPhilippinesPolandPortugalQatarRomaniaRussian FederationRwandaSamoaSan MarinoSao Tome and PrincipeSenegalSerbiaSeychellesSierra LeoneSingaporeSlovak RepublicSloveniaSolomon IslandsSouth AfricaSpainSri LankaSt. Kitts and NevisSt. LuciaSt. Vincent and the GrenadinesSurinameSwazilandSwedenSwitzerlandSyrian Arab RepublicTajikistanTanzaniaThailandTimor-LesteTogoTrinidad and TobagoTunisiaTurkeyUgandaUkraineUnited Arab EmiratesUnited KingdomUnited StatesUruguayVanuatuVenezuela, RBVietnamWest Bank and GazaYemen, Rep.ZambiaZimbabwe
La ligne de temps
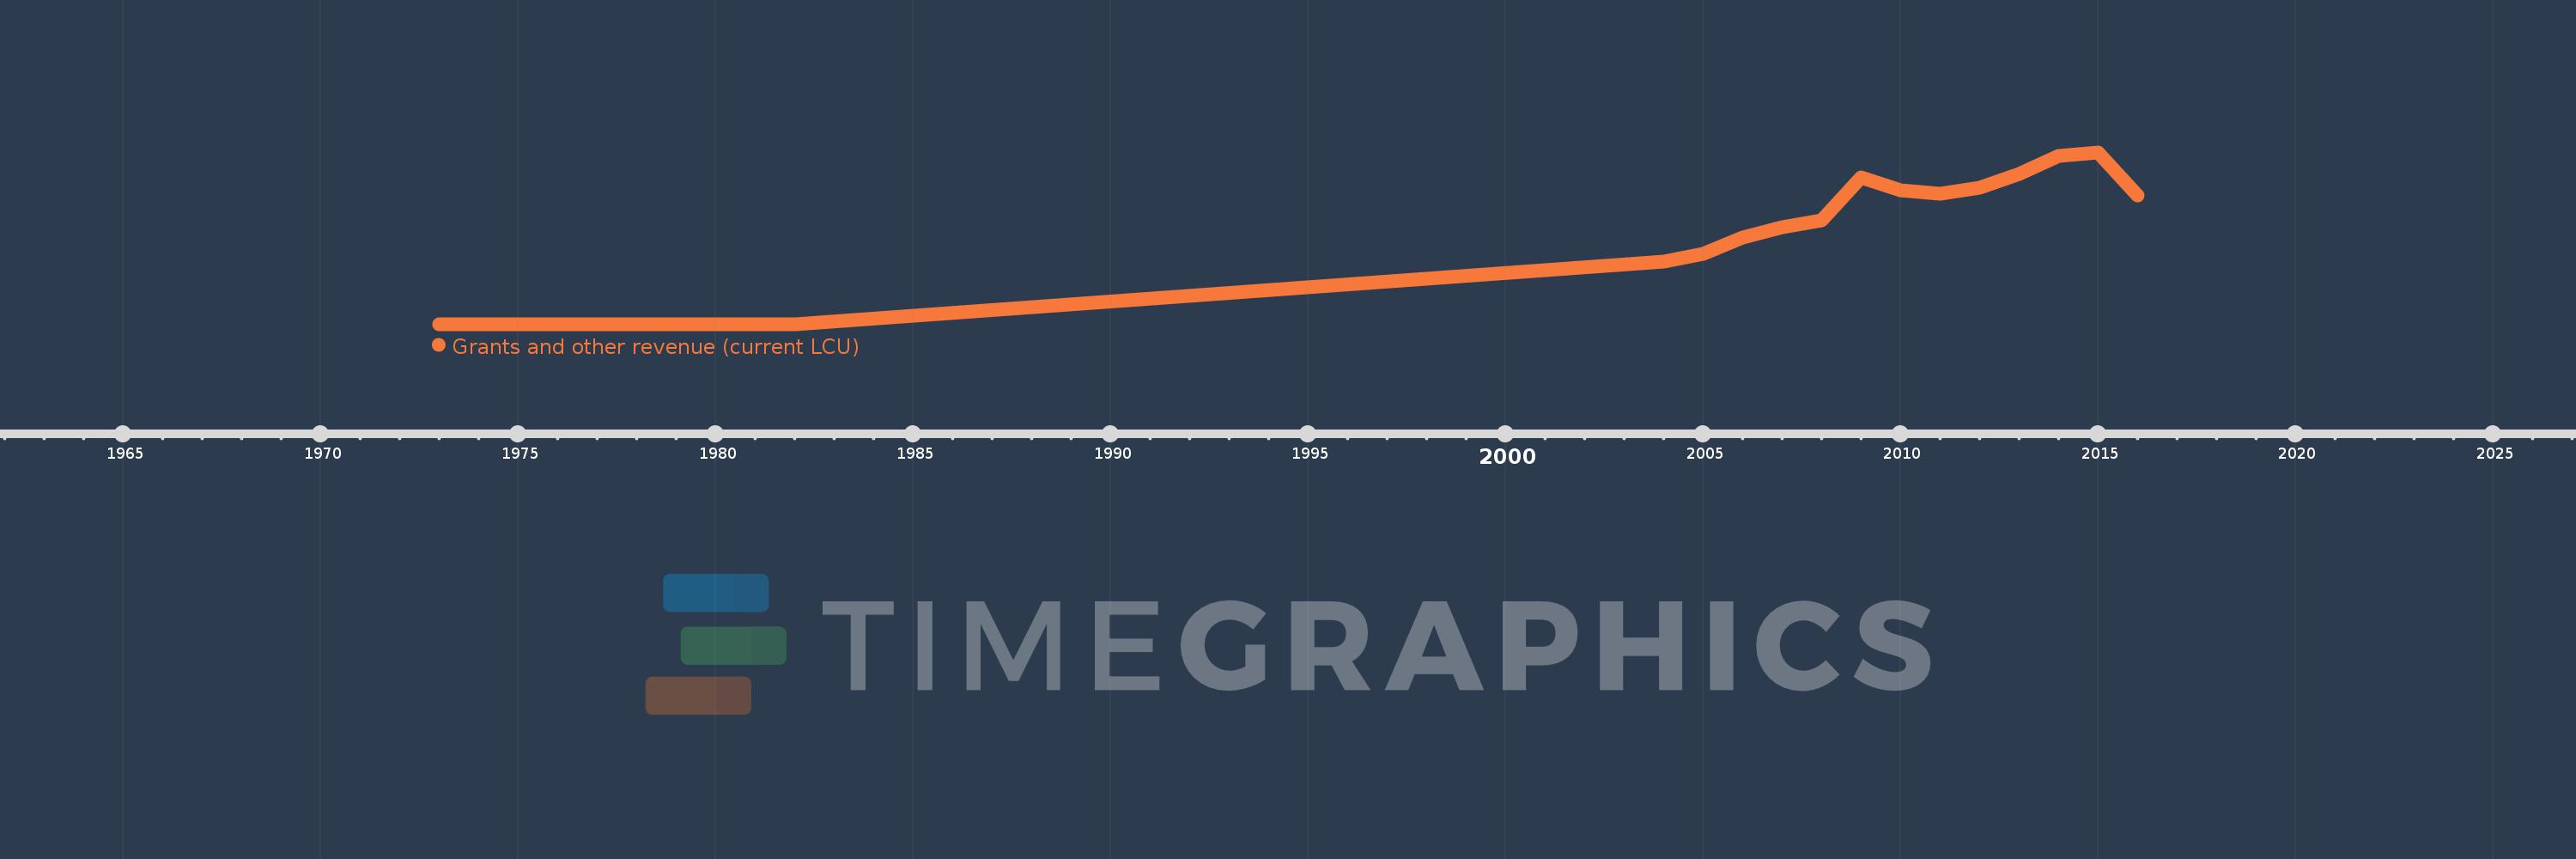
Cette échelle de temps montre un graphique de 1973 année à 2016 année Honduras. Les données jusqu'à 1972 année ne sont pas présentés. Quantité d'observations actuelles selon dates: 23.
Source (désignation):
Les indicateurs du développement mondiale
Source (organisation):
International Monetary Fund, Government Finance Statistics Yearbook and data files.
Catégories:
Public Sector
Dernière mise à jour
23 avr. 2017
Les indicateurs de changement de valeurs selon les années
En moyenne:
7.295 mds
Minimum:
28.1 mln.
1 janv. 1973
Maximum:
18.11 mds
1 janv. 2015
Pour la date d''observation
Valeur
Changement absolu
Le changement par rapport à la valeur précédente
1 janv. 1973
28.1 mln.
+28.1 mln.
0.0%
1 janv. 1974
31.2 mln.
+3.1 mln.
11.03%
1 janv. 1975
29.7 mln.
-1.5 mln.
-4.81%
1 janv. 1976
38.6 mln.
+8.9 mln.
29.97%
1 janv. 1977
52.7 mln.
+14.1 mln.
36.53%
1 janv. 1978
39.7 mln.
-13.0 mln.
-24.67%
1 janv. 1979
29.7 mln.
-10.0 mln.
-25.19%
1 janv. 1980
54.8 mln.
+25.1 mln.
84.51%
1 janv. 1981
48.7 mln.
-6.1 mln.
-11.13%
1 janv. 1982
42.1 mln.
-6.6 mln.
-13.55%
1 janv. 2004
6.657 mds
+6.615 mds
15.71 milles%
1 janv. 2005
7.412 mds
+754.82 mln.
11.34%
1 janv. 2006
9.175 mds
+1.763 mds
23.78%
1 janv. 2007
10.196 mds
+1.021 mds
11.13%
1 janv. 2008
10.931 mds
+735.63 mln.
7.22%
1 janv. 2009
15.498 mds
+4.566 mds
41.77%
1 janv. 2010
14.148 mds
-1.35 mds
-8.71%
1 janv. 2011
13.756 mds
-392.4 mln.
-2.77%
1 janv. 2012
14.401 mds
+645.249 mln.
4.69%
1 janv. 2013
15.806 mds
+1.405 mds
9.75%
1 janv. 2014
17.736 mds
+1.93 mds
12.21%
1 janv. 2015
18.11 mds
+374.022 mln.
2.11%
1 janv. 2016
13.575 mds
-4.535 mds
-25.04%
Classement des pays selon les statistiques actuelles par années

Commentaires:

Envoyer
PremiumAbout & FeedbackUn accordConfidentialité
logo
© 2022 Selected Technologies LLC – Morgan Hill, California