29
/fr/
fr
AIzaSyAYiBZKx7MnpbEhh9jyipgxe19OcubqV5w
April 1, 2024
191443
Malta
MLT
true
2
1
Grants and other revenue (current LCU)
1995,1994,1993,1992,1991,1990,1989,1988,1987,1986,1985,1984,1983,1982,1981,1979,1978,1977,1976,1975,1974,1973
Download
Bibliothèque de statistiques globales →Malta →

Grants and other revenue (current LCU)

Cette statistique dans les autres pays:
AfghanistanAlbaniaAlgeriaAngolaAntigua and BarbudaArgentinaArmeniaAustraliaAustriaAzerbaijanBahamas, TheBahrainBangladeshBarbadosBelarusBelgiumBelizeBeninBhutanBoliviaBosnia and HerzegovinaBotswanaBrazilBulgariaBurkina FasoBurundiCabo VerdeCambodiaCanadaCentral African RepublicChileChinaColombiaCongo, Dem. Rep.Congo, Rep.Costa RicaCote d'IvoireCroatiaCyprusCzech RepublicDenmarkDominicaDominican RepublicEgypt, Arab Rep.El SalvadorEquatorial GuineaEstoniaEthiopiaFijiFinlandFranceGambia, TheGeorgiaGermanyGhanaGreeceGrenadaGuatemalaHondurasHong Kong SAR, ChinaHungaryIcelandIndiaIndonesiaIran, Islamic Rep.IraqIrelandIsraelItalyJamaicaJapanJordanKazakhstanKenyaKiribatiKorea, Rep.KuwaitKyrgyz RepublicLao PDRLatviaLebanonLesothoLiberiaLithuaniaLuxembourgMacao SAR, ChinaMacedonia, FYRMadagascarMalawiMalaysiaMaldivesMaliMaltaMauritiusMexicoMicronesia, Fed. Sts.MoldovaMongoliaMoroccoMozambiqueMyanmarNamibiaNepalNetherlandsNew ZealandNicaraguaNigeriaNorwayOmanPakistanPanamaPapua New GuineaParaguayPeruPhilippinesPolandPortugalQatarRomaniaRussian FederationRwandaSamoaSan MarinoSao Tome and PrincipeSenegalSerbiaSeychellesSierra LeoneSingaporeSlovak RepublicSloveniaSolomon IslandsSouth AfricaSpainSri LankaSt. Kitts and NevisSt. LuciaSt. Vincent and the GrenadinesSurinameSwazilandSwedenSwitzerlandSyrian Arab RepublicTajikistanTanzaniaThailandTimor-LesteTogoTrinidad and TobagoTunisiaTurkeyUgandaUkraineUnited Arab EmiratesUnited KingdomUnited StatesUruguayVanuatuVenezuela, RBVietnamWest Bank and GazaYemen, Rep.ZambiaZimbabwe
La ligne de temps
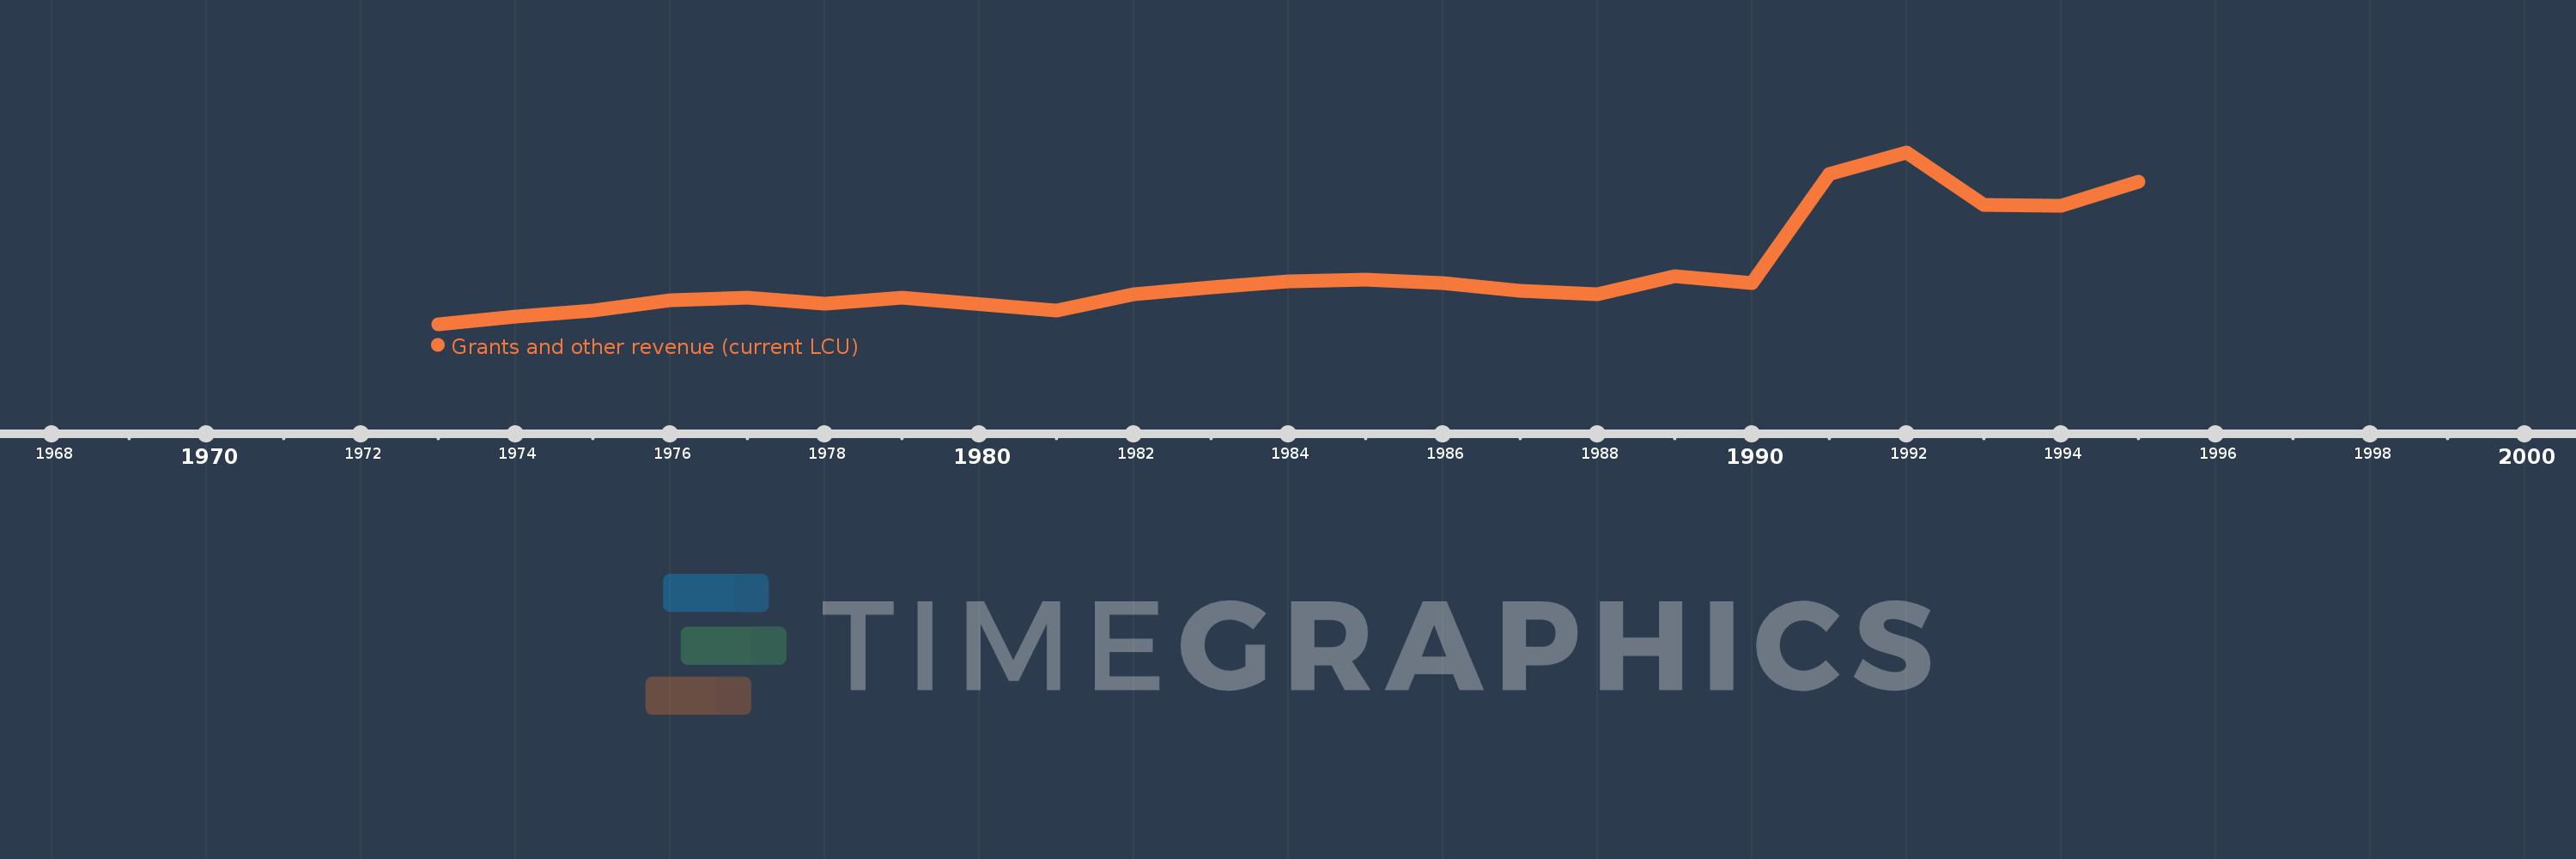
Cette échelle de temps montre un graphique de 1973 année à 1995 année Malta. Les données jusqu'à 1972 année ne sont pas présentés. Quantité d'observations actuelles selon dates: 22.
Source (désignation):
Les indicateurs du développement mondiale
Source (organisation):
International Monetary Fund, Government Finance Statistics Yearbook and data files.
Catégories:
Public Sector
Dernière mise à jour
23 avr. 2017
Les indicateurs de changement de valeurs selon les années
En moyenne:
215.073 mln.
Minimum:
34.195 mln.
1 janv. 1973
Maximum:
612.756 mln.
1 janv. 1992
Pour la date d''observation
Valeur
Changement absolu
Le changement par rapport à la valeur précédente
1 janv. 1973
34.195 mln.
+34.195 mln.
0.0%
1 janv. 1974
59.818 mln.
+25.623 mln.
74.93%
1 janv. 1975
79.734 mln.
+19.916 mln.
33.29%
1 janv. 1976
113.534 mln.
+33.799 mln.
42.39%
1 janv. 1977
124.854 mln.
+11.321 mln.
9.97%
1 janv. 1978
103.494 mln.
-21.36 mln.
-17.11%
1 janv. 1979
122.385 mln.
+18.891 mln.
18.25%
1 janv. 1981
78.989 mln.
-43.396 mln.
-35.46%
1 janv. 1982
135.43 mln.
+56.441 mln.
71.45%
1 janv. 1983
157.186 mln.
+21.756 mln.
16.06%
1 janv. 1984
178.15 mln.
+20.964 mln.
13.34%
1 janv. 1985
183.578 mln.
+5.427 mln.
3.05%
1 janv. 1986
171.884 mln.
-11.693 mln.
-6.37%
1 janv. 1987
147.356 mln.
-24.528 mln.
-14.27%
1 janv. 1988
136.478 mln.
-10.878 mln.
-7.38%
1 janv. 1989
194.782 mln.
+58.304 mln.
42.72%
1 janv. 1990
172.35 mln.
-22.432 mln.
-11.52%
1 janv. 1991
541.459 mln.
+369.108 mln.
214.16%
1 janv. 1992
612.756 mln.
+71.297 mln.
13.17%
1 janv. 1993
435.869 mln.
-176.887 mln.
-28.87%
1 janv. 1994
433.482 mln.
-2.387 mln.
-0.55%
1 janv. 1995
513.84 mln.
+80.359 mln.
18.54%
Classement des pays selon les statistiques actuelles par années

Commentaires:

Envoyer
PremiumAbout & FeedbackUn accordConfidentialité
logo
© 2022 Selected Technologies LLC – Morgan Hill, California