29
/fr/
fr
AIzaSyAYiBZKx7MnpbEhh9jyipgxe19OcubqV5w
April 1, 2024
133185
Finland
FIN
true
2
1
Grants and other revenue (current LCU)
1995,1994,1993,1992,1991,1990,1989,1988,1987,1986,1985,1984,1983,1982,1981,1980,1979,1978,1977,1976,1975,1974,1973
Download
Bibliothèque de statistiques globales →Finland →

Grants and other revenue (current LCU)

Cette statistique dans les autres pays:
AfghanistanAlbaniaAlgeriaAngolaAntigua and BarbudaArgentinaArmeniaAustraliaAustriaAzerbaijanBahamas, TheBahrainBangladeshBarbadosBelarusBelgiumBelizeBeninBhutanBoliviaBosnia and HerzegovinaBotswanaBrazilBulgariaBurkina FasoBurundiCabo VerdeCambodiaCanadaCentral African RepublicChileChinaColombiaCongo, Dem. Rep.Congo, Rep.Costa RicaCote d'IvoireCroatiaCyprusCzech RepublicDenmarkDominicaDominican RepublicEgypt, Arab Rep.El SalvadorEquatorial GuineaEstoniaEthiopiaFijiFinlandFranceGambia, TheGeorgiaGermanyGhanaGreeceGrenadaGuatemalaHondurasHong Kong SAR, ChinaHungaryIcelandIndiaIndonesiaIran, Islamic Rep.IraqIrelandIsraelItalyJamaicaJapanJordanKazakhstanKenyaKiribatiKorea, Rep.KuwaitKyrgyz RepublicLao PDRLatviaLebanonLesothoLiberiaLithuaniaLuxembourgMacao SAR, ChinaMacedonia, FYRMadagascarMalawiMalaysiaMaldivesMaliMaltaMauritiusMexicoMicronesia, Fed. Sts.MoldovaMongoliaMoroccoMozambiqueMyanmarNamibiaNepalNetherlandsNew ZealandNicaraguaNigeriaNorwayOmanPakistanPanamaPapua New GuineaParaguayPeruPhilippinesPolandPortugalQatarRomaniaRussian FederationRwandaSamoaSan MarinoSao Tome and PrincipeSenegalSerbiaSeychellesSierra LeoneSingaporeSlovak RepublicSloveniaSolomon IslandsSouth AfricaSpainSri LankaSt. Kitts and NevisSt. LuciaSt. Vincent and the GrenadinesSurinameSwazilandSwedenSwitzerlandSyrian Arab RepublicTajikistanTanzaniaThailandTimor-LesteTogoTrinidad and TobagoTunisiaTurkeyUgandaUkraineUnited Arab EmiratesUnited KingdomUnited StatesUruguayVanuatuVenezuela, RBVietnamWest Bank and GazaYemen, Rep.ZambiaZimbabwe
La ligne de temps
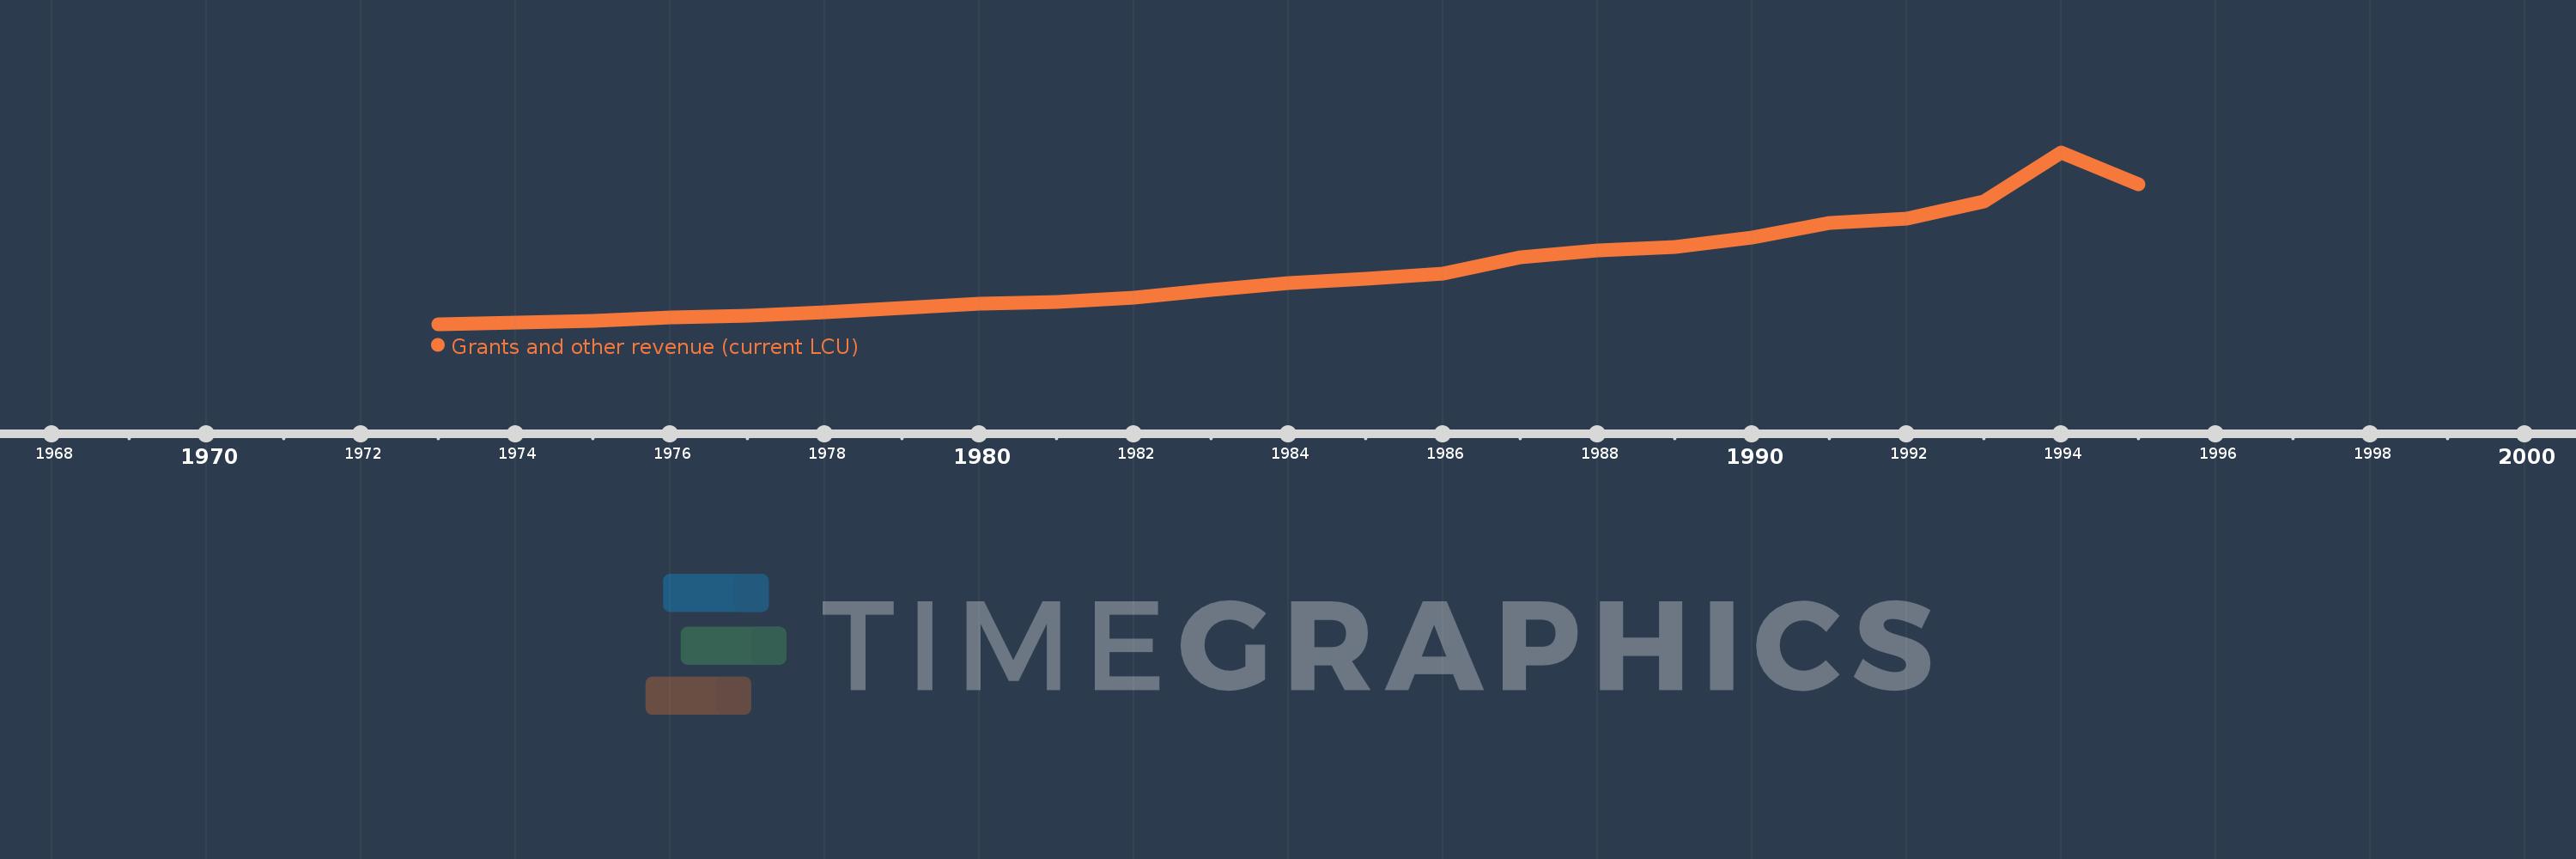
Cette échelle de temps montre un graphique de 1973 année à 1995 année Finland. Les données jusqu'à 1972 année ne sont pas présentés. Quantité d'observations actuelles selon dates: 23.
Source (désignation):
Les indicateurs du développement mondiale
Source (organisation):
International Monetary Fund, Government Finance Statistics Yearbook and data files.
Catégories:
Public Sector
Dernière mise à jour
23 avr. 2017
Les indicateurs de changement de valeurs selon les années
En moyenne:
1.709 mds
Minimum:
190.389 mln.
1 janv. 1973
Maximum:
5.044 mds
1 janv. 1994
Pour la date d''observation
Valeur
Changement absolu
Le changement par rapport à la valeur précédente
1 janv. 1973
190.389 mln.
+190.389 mln.
0.0%
1 janv. 1974
241.35 mln.
+50.961 mln.
26.77%
1 janv. 1975
276.669 mln.
+35.319 mln.
14.63%
1 janv. 1976
388.01 mln.
+111.34 mln.
40.24%
1 janv. 1977
439.98 mln.
+51.97 mln.
13.39%
1 janv. 1978
535.679 mln.
+95.699 mln.
21.75%
1 janv. 1979
644.664 mln.
+108.986 mln.
20.35%
1 janv. 1980
771.814 mln.
+127.15 mln.
19.72%
1 janv. 1981
822.944 mln.
+51.129 mln.
6.62%
1 janv. 1982
938.489 mln.
+115.545 mln.
14.04%
1 janv. 1983
1.154 mds
+215.281 mln.
22.94%
1 janv. 1984
1.343 mds
+188.875 mln.
16.37%
1 janv. 1985
1.473 mds
+130.009 mln.
9.68%
1 janv. 1986
1.626 mds
+153.724 mln.
10.44%
1 janv. 1987
2.081 mds
+455.117 mln.
27.98%
1 janv. 1988
2.277 mds
+195.939 mln.
9.41%
1 janv. 1989
2.377 mds
+99.399 mln.
4.36%
1 janv. 1990
2.644 mds
+267.419 mln.
11.25%
1 janv. 1991
3.059 mds
+415.088 mln.
15.7%
1 janv. 1992
3.177 mds
+117.227 mln.
3.83%
1 janv. 1993
3.658 mds
+481.017 mln.
15.14%
1 janv. 1994
5.044 mds
+1.387 mds
37.91%
1 janv. 1995
4.141 mds
-903.506 mln.
-17.91%
Classement des pays selon les statistiques actuelles par années

Commentaires:

Envoyer
PremiumAbout & FeedbackUn accordConfidentialité
logo
© 2022 Selected Technologies LLC – Morgan Hill, California