29
/fr/
fr
AIzaSyAYiBZKx7MnpbEhh9jyipgxe19OcubqV5w
April 1, 2024
285936
Zambia
ZMB
true
2
1
Grants and other revenue (current LCU)
2012,2011,2010,2009,2008,2007,2006,2005,2004,2003,2002,2000,1999,1998,1997,1996,1995,1994,1993,1992,1991
Download
Bibliothèque de statistiques globales →Zambia →

Grants and other revenue (current LCU)

Cette statistique dans les autres pays:
AfghanistanAlbaniaAlgeriaAngolaAntigua and BarbudaArgentinaArmeniaAustraliaAustriaAzerbaijanBahamas, TheBahrainBangladeshBarbadosBelarusBelgiumBelizeBeninBhutanBoliviaBosnia and HerzegovinaBotswanaBrazilBulgariaBurkina FasoBurundiCabo VerdeCambodiaCanadaCentral African RepublicChileChinaColombiaCongo, Dem. Rep.Congo, Rep.Costa RicaCote d'IvoireCroatiaCyprusCzech RepublicDenmarkDominicaDominican RepublicEgypt, Arab Rep.El SalvadorEquatorial GuineaEstoniaEthiopiaFijiFinlandFranceGambia, TheGeorgiaGermanyGhanaGreeceGrenadaGuatemalaHondurasHong Kong SAR, ChinaHungaryIcelandIndiaIndonesiaIran, Islamic Rep.IraqIrelandIsraelItalyJamaicaJapanJordanKazakhstanKenyaKiribatiKorea, Rep.KuwaitKyrgyz RepublicLao PDRLatviaLebanonLesothoLiberiaLithuaniaLuxembourgMacao SAR, ChinaMacedonia, FYRMadagascarMalawiMalaysiaMaldivesMaliMaltaMauritiusMexicoMicronesia, Fed. Sts.MoldovaMongoliaMoroccoMozambiqueMyanmarNamibiaNepalNetherlandsNew ZealandNicaraguaNigeriaNorwayOmanPakistanPanamaPapua New GuineaParaguayPeruPhilippinesPolandPortugalQatarRomaniaRussian FederationRwandaSamoaSan MarinoSao Tome and PrincipeSenegalSerbiaSeychellesSierra LeoneSingaporeSlovak RepublicSloveniaSolomon IslandsSouth AfricaSpainSri LankaSt. Kitts and NevisSt. LuciaSt. Vincent and the GrenadinesSurinameSwazilandSwedenSwitzerlandSyrian Arab RepublicTajikistanTanzaniaThailandTimor-LesteTogoTrinidad and TobagoTunisiaTurkeyUgandaUkraineUnited Arab EmiratesUnited KingdomUnited StatesUruguayVanuatuVenezuela, RBVietnamWest Bank and GazaYemen, Rep.ZambiaZimbabwe
La ligne de temps
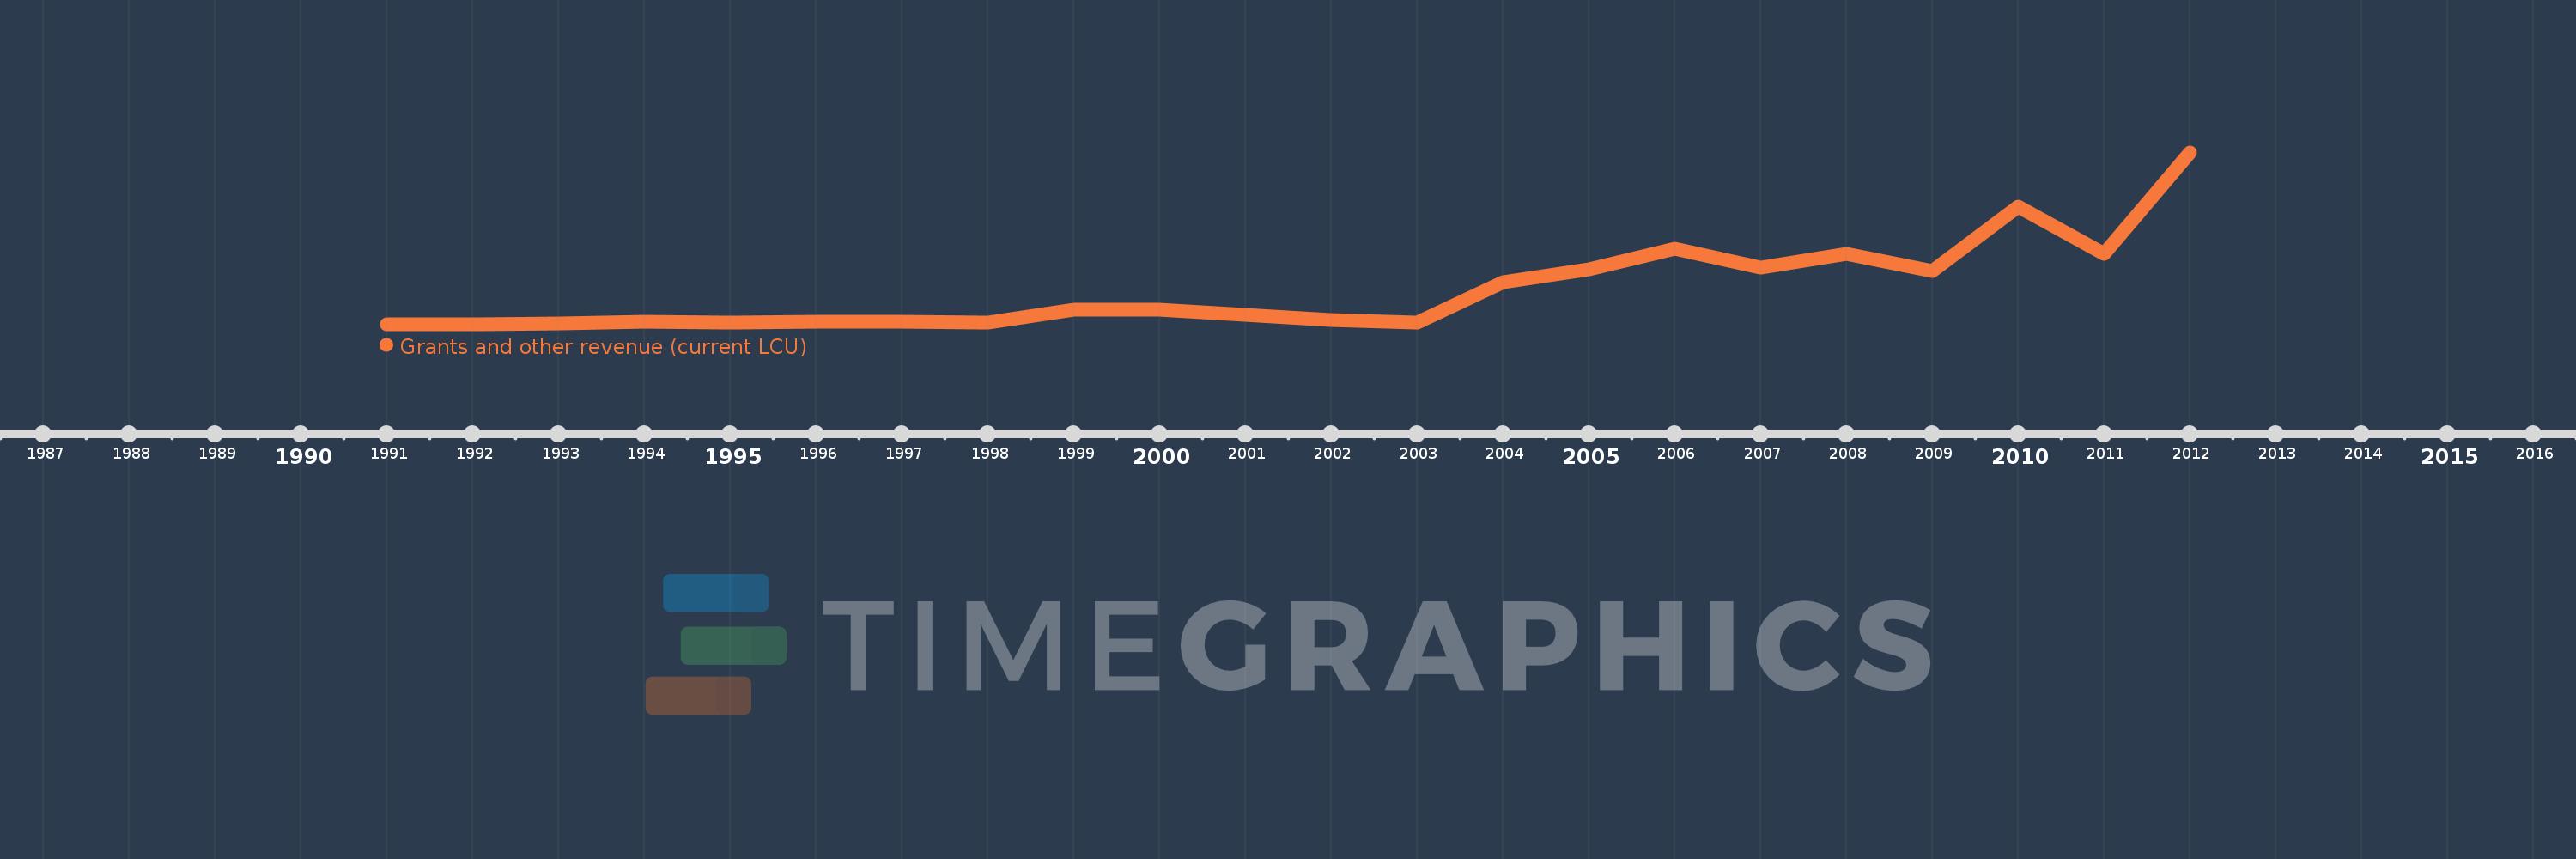
Cette échelle de temps montre un graphique de 1991 année à 2012 année Zambia. Les données jusqu'à 1990 année ne sont pas présentés. Quantité d'observations actuelles selon dates: 21.
Source (désignation):
Les indicateurs du développement mondiale
Source (organisation):
International Monetary Fund, Government Finance Statistics Yearbook and data files.
Catégories:
Public Sector
Dernière mise à jour
23 avr. 2017
Les indicateurs de changement de valeurs selon les années
En moyenne:
1.18 mds
Minimum:
1.363 mln.
1 janv. 1991
Maximum:
5.62 mds
1 janv. 2012
Pour la date d''observation
Valeur
Changement absolu
Le changement par rapport à la valeur précédente
1 janv. 1991
1.363 mln.
+1.363 mln.
0.0%
1 janv. 1992
6.009 mln.
+4.646 mln.
340.7%
1 janv. 1993
36.742 mln.
+30.733 mln.
511.46%
1 janv. 1994
78.957 mln.
+42.215 mln.
114.89%
1 janv. 1995
47.018 mln.
-31.94 mln.
-40.45%
1 janv. 1996
90.2 mln.
+43.182 mln.
91.84%
1 janv. 1997
70.701 mln.
-19.499 mln.
-21.62%
1 janv. 1998
42.1 mln.
-28.601 mln.
-40.45%
1 janv. 1999
463.7 mln.
+421.6 mln.
1.0 milles%
1 janv. 2000
466.1 mln.
+2.4 mln.
0.52%
1 janv. 2002
144.795 mln.
-321.305 mln.
-68.93%
1 janv. 2003
54.449 mln.
-90.346 mln.
-62.4%
1 janv. 2004
1.366 mds
+1.312 mds
2.41 milles%
1 janv. 2005
1.787 mds
+420.326 mln.
30.76%
1 janv. 2006
2.472 mds
+685.104 mln.
38.34%
1 janv. 2007
1.862 mds
-609.809 mln.
-24.67%
1 janv. 2008
2.293 mds
+430.598 mln.
23.13%
1 janv. 2009
1.731 mds
-561.155 mln.
-24.48%
1 janv. 2010
3.855 mds
+2.124 mds
122.65%
1 janv. 2011
2.294 mds
-1.561 mds
-40.48%
1 janv. 2012
5.62 mds
+3.326 mds
144.94%
Classement des pays selon les statistiques actuelles par années

Commentaires:

Envoyer
PremiumAbout & FeedbackUn accordConfidentialité
logo
© 2022 Selected Technologies LLC – Morgan Hill, California