29
/fr/
fr
AIzaSyAYiBZKx7MnpbEhh9jyipgxe19OcubqV5w
April 1, 2024
197591
Moldova
MDA
true
2
1
Grants and other revenue (current LCU)
2015,2014,2013,2012,2011,2010,2009,2008,2007,2006,2005,2004,2003,2002,2001,2000,1999,1998,1997,1996
Download
Bibliothèque de statistiques globales →Moldova →

Grants and other revenue (current LCU)

Cette statistique dans les autres pays:
AfghanistanAlbaniaAlgeriaAngolaAntigua and BarbudaArgentinaArmeniaAustraliaAustriaAzerbaijanBahamas, TheBahrainBangladeshBarbadosBelarusBelgiumBelizeBeninBhutanBoliviaBosnia and HerzegovinaBotswanaBrazilBulgariaBurkina FasoBurundiCabo VerdeCambodiaCanadaCentral African RepublicChileChinaColombiaCongo, Dem. Rep.Congo, Rep.Costa RicaCote d'IvoireCroatiaCyprusCzech RepublicDenmarkDominicaDominican RepublicEgypt, Arab Rep.El SalvadorEquatorial GuineaEstoniaEthiopiaFijiFinlandFranceGambia, TheGeorgiaGermanyGhanaGreeceGrenadaGuatemalaHondurasHong Kong SAR, ChinaHungaryIcelandIndiaIndonesiaIran, Islamic Rep.IraqIrelandIsraelItalyJamaicaJapanJordanKazakhstanKenyaKiribatiKorea, Rep.KuwaitKyrgyz RepublicLao PDRLatviaLebanonLesothoLiberiaLithuaniaLuxembourgMacao SAR, ChinaMacedonia, FYRMadagascarMalawiMalaysiaMaldivesMaliMaltaMauritiusMexicoMicronesia, Fed. Sts.MoldovaMongoliaMoroccoMozambiqueMyanmarNamibiaNepalNetherlandsNew ZealandNicaraguaNigeriaNorwayOmanPakistanPanamaPapua New GuineaParaguayPeruPhilippinesPolandPortugalQatarRomaniaRussian FederationRwandaSamoaSan MarinoSao Tome and PrincipeSenegalSerbiaSeychellesSierra LeoneSingaporeSlovak RepublicSloveniaSolomon IslandsSouth AfricaSpainSri LankaSt. Kitts and NevisSt. LuciaSt. Vincent and the GrenadinesSurinameSwazilandSwedenSwitzerlandSyrian Arab RepublicTajikistanTanzaniaThailandTimor-LesteTogoTrinidad and TobagoTunisiaTurkeyUgandaUkraineUnited Arab EmiratesUnited KingdomUnited StatesUruguayVanuatuVenezuela, RBVietnamWest Bank and GazaYemen, Rep.ZambiaZimbabwe
La ligne de temps
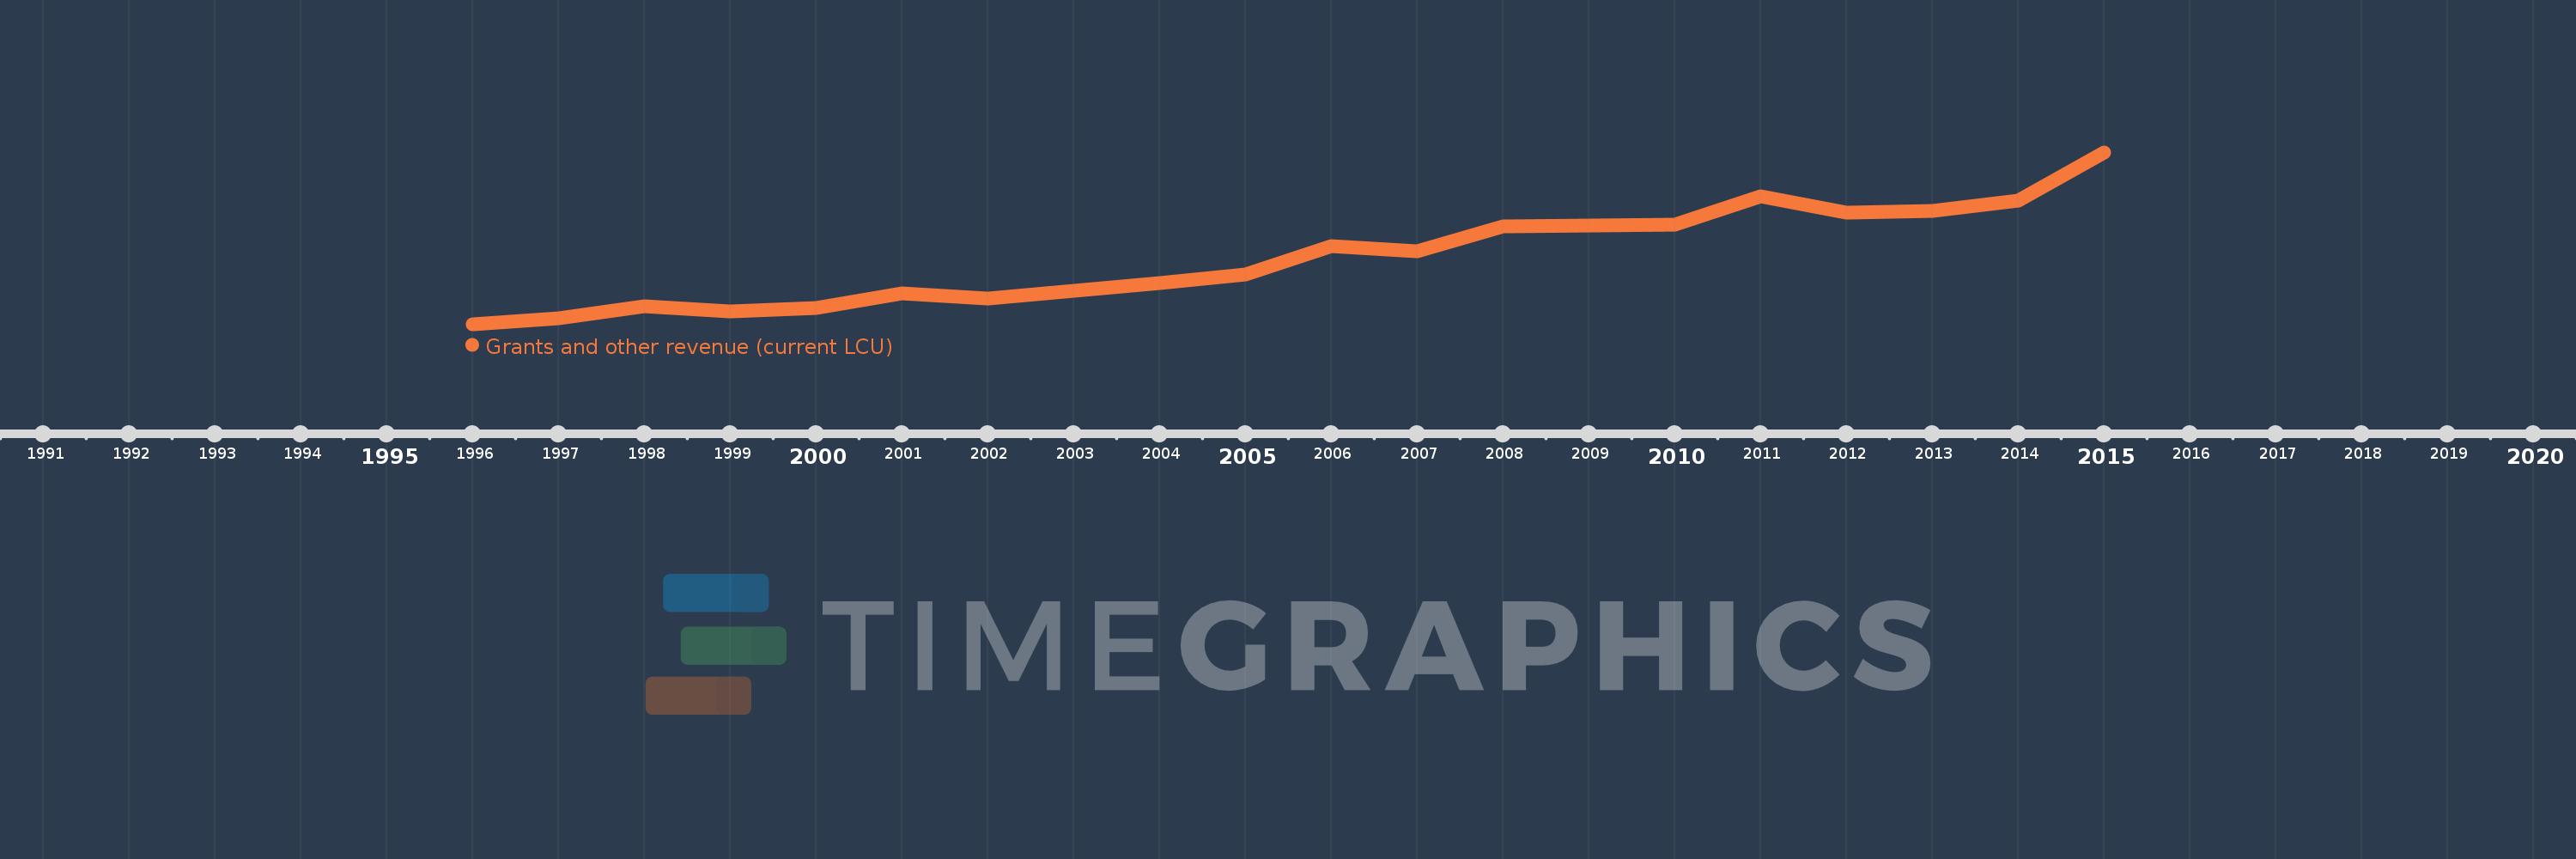
Cette échelle de temps montre un graphique de 1996 année à 2015 année Moldova. Les données jusqu'à 1995 année ne sont pas présentés. Quantité d'observations actuelles selon dates: 20.
Source (désignation):
Les indicateurs du développement mondiale
Source (organisation):
International Monetary Fund, Government Finance Statistics Yearbook and data files.
Catégories:
Public Sector
Dernière mise à jour
23 avr. 2017
Les indicateurs de changement de valeurs selon les années
En moyenne:
2.16 mds
Minimum:
44.57 mln.
1 janv. 1996
Maximum:
5.51 mds
1 janv. 2015
Pour la date d''observation
Valeur
Changement absolu
Le changement par rapport à la valeur précédente
1 janv. 1996
44.57 mln.
+44.57 mln.
0.0%
1 janv. 1997
223.2 mln.
+178.63 mln.
400.79%
1 janv. 1998
603.5 mln.
+380.3 mln.
170.39%
1 janv. 1999
463.7 mln.
-139.8 mln.
-23.16%
1 janv. 2000
552.2 mln.
+88.5 mln.
19.09%
1 janv. 2001
1.027 mds
+475.2 mln.
86.06%
1 janv. 2002
865.3 mln.
-162.1 mln.
-15.78%
1 janv. 2003
1.113 mds
+248.2 mln.
28.68%
1 janv. 2004
1.346 mds
+232.6 mln.
20.89%
1 janv. 2005
1.64 mds
+293.5 mln.
21.8%
1 janv. 2006
2.539 mds
+899.5 mln.
54.86%
1 janv. 2007
2.359 mds
-180.3 mln.
-7.1%
1 janv. 2008
3.16 mds
+801.6 mln.
33.98%
1 janv. 2009
3.194 mds
+33.9 mln.
1.07%
1 janv. 2010
3.209 mds
+15.0 mln.
0.47%
1 janv. 2011
4.103 mds
+894.1 mln.
27.86%
1 janv. 2012
3.605 mds
-498.2 mln.
-12.14%
1 janv. 2013
3.661 mds
+56.0 mln.
1.55%
1 janv. 2014
3.982 mds
+321.3 mln.
8.78%
1 janv. 2015
5.51 mds
+1.528 mds
38.36%
Classement des pays selon les statistiques actuelles par années

Commentaires:

Envoyer
PremiumAbout & FeedbackUn accordConfidentialité
logo
© 2022 Selected Technologies LLC – Morgan Hill, California