29
/fr/
fr
AIzaSyAYiBZKx7MnpbEhh9jyipgxe19OcubqV5w
April 1, 2024
82822
Belize
BLZ
true
2
1
Grants and other revenue (current LCU)
2015,2014,2013,2012,2011,2010,2009,2008,2007,2006,2005,2004,2003,2002,2001,2000,1999,1998,1997,1996,1995,1994,1993,1992,1991
Download
Bibliothèque de statistiques globales →Belize →

Grants and other revenue (current LCU)

Cette statistique dans les autres pays:
AfghanistanAlbaniaAlgeriaAngolaAntigua and BarbudaArgentinaArmeniaAustraliaAustriaAzerbaijanBahamas, TheBahrainBangladeshBarbadosBelarusBelgiumBelizeBeninBhutanBoliviaBosnia and HerzegovinaBotswanaBrazilBulgariaBurkina FasoBurundiCabo VerdeCambodiaCanadaCentral African RepublicChileChinaColombiaCongo, Dem. Rep.Congo, Rep.Costa RicaCote d'IvoireCroatiaCyprusCzech RepublicDenmarkDominicaDominican RepublicEgypt, Arab Rep.El SalvadorEquatorial GuineaEstoniaEthiopiaFijiFinlandFranceGambia, TheGeorgiaGermanyGhanaGreeceGrenadaGuatemalaHondurasHong Kong SAR, ChinaHungaryIcelandIndiaIndonesiaIran, Islamic Rep.IraqIrelandIsraelItalyJamaicaJapanJordanKazakhstanKenyaKiribatiKorea, Rep.KuwaitKyrgyz RepublicLao PDRLatviaLebanonLesothoLiberiaLithuaniaLuxembourgMacao SAR, ChinaMacedonia, FYRMadagascarMalawiMalaysiaMaldivesMaliMaltaMauritiusMexicoMicronesia, Fed. Sts.MoldovaMongoliaMoroccoMozambiqueMyanmarNamibiaNepalNetherlandsNew ZealandNicaraguaNigeriaNorwayOmanPakistanPanamaPapua New GuineaParaguayPeruPhilippinesPolandPortugalQatarRomaniaRussian FederationRwandaSamoaSan MarinoSao Tome and PrincipeSenegalSerbiaSeychellesSierra LeoneSingaporeSlovak RepublicSloveniaSolomon IslandsSouth AfricaSpainSri LankaSt. Kitts and NevisSt. LuciaSt. Vincent and the GrenadinesSurinameSwazilandSwedenSwitzerlandSyrian Arab RepublicTajikistanTanzaniaThailandTimor-LesteTogoTrinidad and TobagoTunisiaTurkeyUgandaUkraineUnited Arab EmiratesUnited KingdomUnited StatesUruguayVanuatuVenezuela, RBVietnamWest Bank and GazaYemen, Rep.ZambiaZimbabwe
La ligne de temps
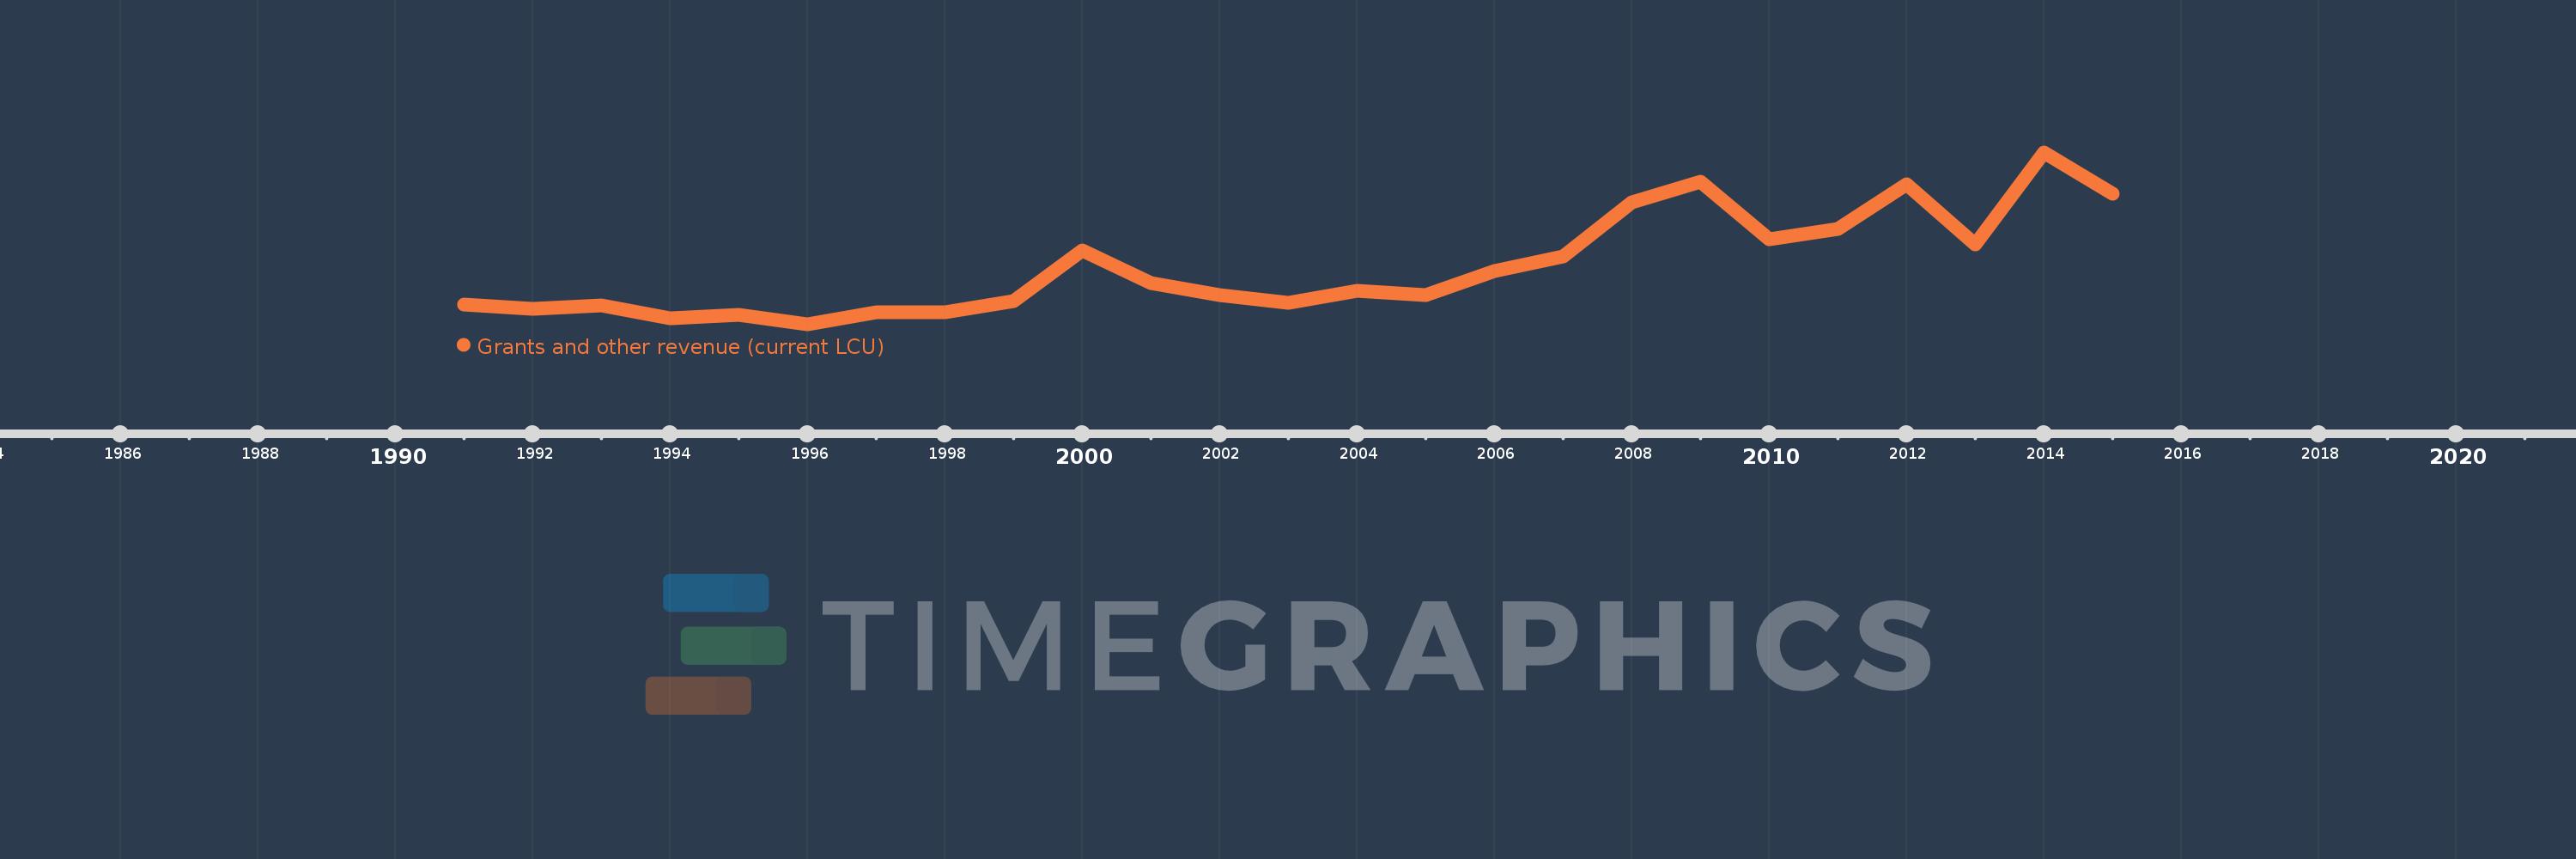
Cette échelle de temps montre un graphique de 1991 année à 2015 année Belize. Les données jusqu'à 1990 année ne sont pas présentés. Quantité d'observations actuelles selon dates: 25.
Source (désignation):
Les indicateurs du développement mondiale
Source (organisation):
International Monetary Fund, Government Finance Statistics Yearbook and data files.
Catégories:
Public Sector
Dernière mise à jour
23 avr. 2017
Les indicateurs de changement de valeurs selon les années
En moyenne:
80.38 mln.
Minimum:
27.928 mln.
1 janv. 1996
Maximum:
185.368 mln.
1 janv. 2014
Pour la date d''observation
Valeur
Changement absolu
Le changement par rapport à la valeur précédente
1 janv. 1991
45.911 mln.
+45.911 mln.
0.0%
1 janv. 1992
42.323 mln.
-3.588 mln.
-7.82%
1 janv. 1993
45.263 mln.
+2.94 mln.
6.95%
1 janv. 1994
33.706 mln.
-11.557 mln.
-25.53%
1 janv. 1995
36.176 mln.
+2.47 mln.
7.33%
1 janv. 1996
27.928 mln.
-8.248 mln.
-22.8%
1 janv. 1997
38.781 mln.
+10.853 mln.
38.86%
1 janv. 1998
38.95 mln.
+169.0 milles
0.44%
1 janv. 1999
48.973 mln.
+10.023 mln.
25.73%
1 janv. 2000
95.685 mln.
+46.712 mln.
95.38%
1 janv. 2001
65.51 mln.
-30.175 mln.
-31.54%
1 janv. 2002
54.449 mln.
-11.061 mln.
-16.88%
1 janv. 2003
47.151 mln.
-7.298 mln.
-13.4%
1 janv. 2004
58.234 mln.
+11.083 mln.
23.51%
1 janv. 2005
54.276 mln.
-3.958 mln.
-6.8%
1 janv. 2006
76.896 mln.
+22.62 mln.
41.68%
1 janv. 2007
90.272 mln.
+13.376 mln.
17.39%
1 janv. 2008
139.612 mln.
+49.34 mln.
54.66%
1 janv. 2009
158.479 mln.
+18.867 mln.
13.51%
1 janv. 2010
106.023 mln.
-52.456 mln.
-33.1%
1 janv. 2011
115.073 mln.
+9.05 mln.
8.54%
1 janv. 2012
156.013 mln.
+40.94 mln.
35.58%
1 janv. 2013
100.854 mln.
-55.159 mln.
-35.36%
1 janv. 2014
185.368 mln.
+84.514 mln.
83.8%
1 janv. 2015
147.586 mln.
-37.782 mln.
-20.38%
Classement des pays selon les statistiques actuelles par années

Commentaires:

Envoyer
PremiumAbout & FeedbackUn accordConfidentialité
logo
© 2022 Selected Technologies LLC – Morgan Hill, California