29
/fr/
fr
AIzaSyAYiBZKx7MnpbEhh9jyipgxe19OcubqV5w
April 1, 2024
138063
Georgia
GEO
true
2
1
Grants and other revenue (current LCU)
2016,2015,2014,2013,2012,2011,2010,2009,2008,2007,2006,2005,2004,2003,2002,2001,2000,1999,1998
Download
Bibliothèque de statistiques globales →Georgia →

Grants and other revenue (current LCU)

Cette statistique dans les autres pays:
AfghanistanAlbaniaAlgeriaAngolaAntigua and BarbudaArgentinaArmeniaAustraliaAustriaAzerbaijanBahamas, TheBahrainBangladeshBarbadosBelarusBelgiumBelizeBeninBhutanBoliviaBosnia and HerzegovinaBotswanaBrazilBulgariaBurkina FasoBurundiCabo VerdeCambodiaCanadaCentral African RepublicChileChinaColombiaCongo, Dem. Rep.Congo, Rep.Costa RicaCote d'IvoireCroatiaCyprusCzech RepublicDenmarkDominicaDominican RepublicEgypt, Arab Rep.El SalvadorEquatorial GuineaEstoniaEthiopiaFijiFinlandFranceGambia, TheGeorgiaGermanyGhanaGreeceGrenadaGuatemalaHondurasHong Kong SAR, ChinaHungaryIcelandIndiaIndonesiaIran, Islamic Rep.IraqIrelandIsraelItalyJamaicaJapanJordanKazakhstanKenyaKiribatiKorea, Rep.KuwaitKyrgyz RepublicLao PDRLatviaLebanonLesothoLiberiaLithuaniaLuxembourgMacao SAR, ChinaMacedonia, FYRMadagascarMalawiMalaysiaMaldivesMaliMaltaMauritiusMexicoMicronesia, Fed. Sts.MoldovaMongoliaMoroccoMozambiqueMyanmarNamibiaNepalNetherlandsNew ZealandNicaraguaNigeriaNorwayOmanPakistanPanamaPapua New GuineaParaguayPeruPhilippinesPolandPortugalQatarRomaniaRussian FederationRwandaSamoaSan MarinoSao Tome and PrincipeSenegalSerbiaSeychellesSierra LeoneSingaporeSlovak RepublicSloveniaSolomon IslandsSouth AfricaSpainSri LankaSt. Kitts and NevisSt. LuciaSt. Vincent and the GrenadinesSurinameSwazilandSwedenSwitzerlandSyrian Arab RepublicTajikistanTanzaniaThailandTimor-LesteTogoTrinidad and TobagoTunisiaTurkeyUgandaUkraineUnited Arab EmiratesUnited KingdomUnited StatesUruguayVanuatuVenezuela, RBVietnamWest Bank and GazaYemen, Rep.ZambiaZimbabwe
La ligne de temps
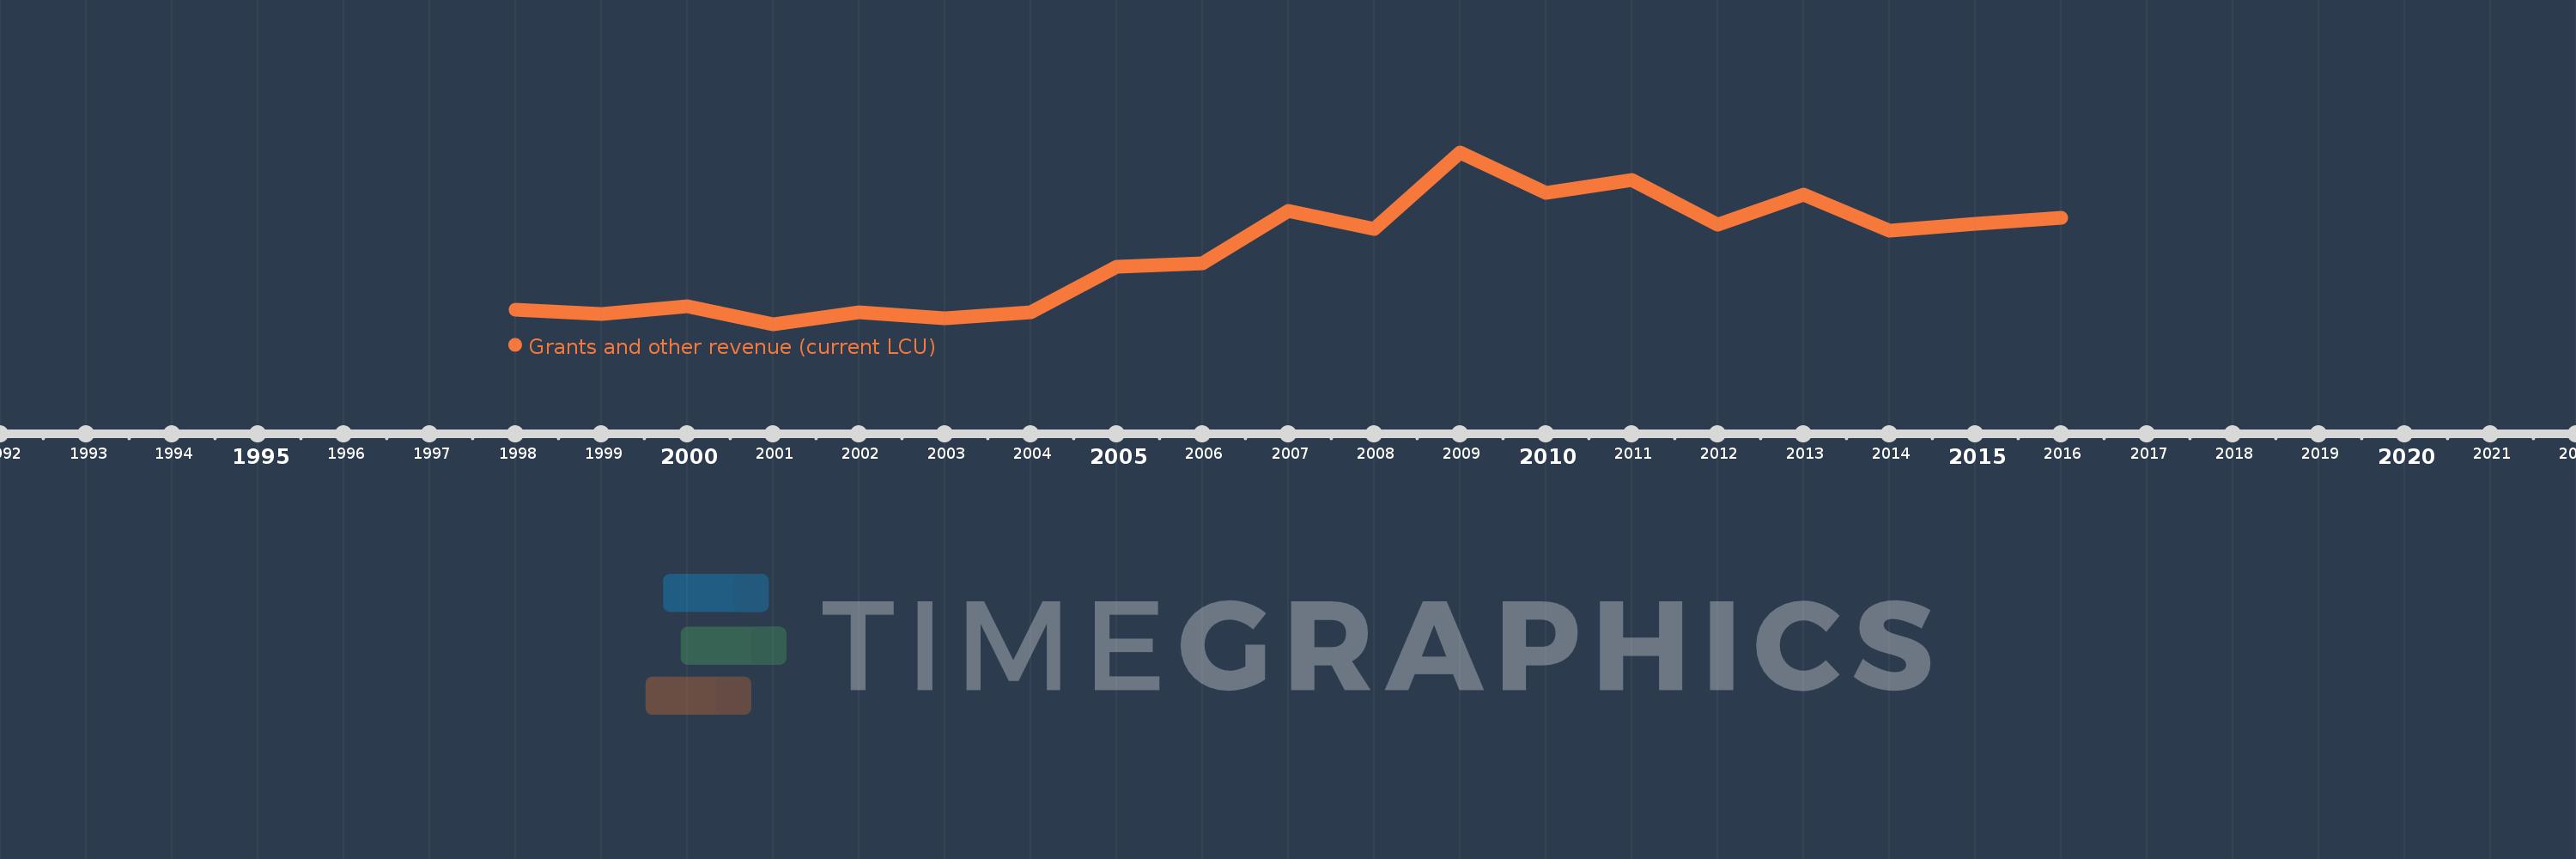
Cette échelle de temps montre un graphique de 1998 année à 2016 année Georgia. Les données jusqu'à 1997 année ne sont pas présentés. Quantité d'observations actuelles selon dates: 19.
Source (désignation):
Les indicateurs du développement mondiale
Source (organisation):
International Monetary Fund, Government Finance Statistics Yearbook and data files.
Catégories:
Public Sector
Dernière mise à jour
23 avr. 2017
Les indicateurs de changement de valeurs selon les années
En moyenne:
438.074 mln.
Minimum:
45.8 mln.
1 janv. 2001
Maximum:
976.1 mln.
1 janv. 2009
Pour la date d''observation
Valeur
Changement absolu
Le changement par rapport à la valeur précédente
1 janv. 1998
125.6 mln.
+125.6 mln.
0.0%
1 janv. 1999
102.2 mln.
-23.4 mln.
-18.63%
1 janv. 2000
144.1 mln.
+41.9 mln.
41.0%
1 janv. 2001
45.8 mln.
-98.3 mln.
-68.22%
1 janv. 2002
109.2 mln.
+63.4 mln.
138.43%
1 janv. 2003
80.0 mln.
-29.2 mln.
-26.74%
1 janv. 2004
108.3 mln.
+28.3 mln.
35.38%
1 janv. 2005
355.4 mln.
+247.1 mln.
228.16%
1 janv. 2006
376.9 mln.
+21.5 mln.
6.05%
1 janv. 2007
660.2 mln.
+283.3 mln.
75.17%
1 janv. 2008
561.0 mln.
-99.2 mln.
-15.03%
1 janv. 2009
976.1 mln.
+415.1 mln.
73.99%
1 janv. 2010
755.3 mln.
-220.8 mln.
-22.62%
1 janv. 2011
829.1 mln.
+73.8 mln.
9.77%
1 janv. 2012
586.8 mln.
-242.3 mln.
-29.22%
1 janv. 2013
747.1 mln.
+160.3 mln.
27.32%
1 janv. 2014
551.8 mln.
-195.3 mln.
-26.14%
1 janv. 2015
587.6 mln.
+35.8 mln.
6.49%
1 janv. 2016
620.9 mln.
+33.3 mln.
5.67%
Classement des pays selon les statistiques actuelles par années

Commentaires:

Envoyer
PremiumAbout & FeedbackUn accordConfidentialité
logo
© 2022 Selected Technologies LLC – Morgan Hill, California