29
/fr/
fr
AIzaSyAYiBZKx7MnpbEhh9jyipgxe19OcubqV5w
April 1, 2024
77153
Bahrain
BHR
true
2
1
Grants and other revenue (current LCU)
2014,2012,2011,2010,2009,2008,2007,2006,2005,2004,2003,2002,2001,2000,1999,1998,1997,1996,1995,1994,1993,1992,1991
Download
Bibliothèque de statistiques globales →Bahrain →

Grants and other revenue (current LCU)

Cette statistique dans les autres pays:
AfghanistanAlbaniaAlgeriaAngolaAntigua and BarbudaArgentinaArmeniaAustraliaAustriaAzerbaijanBahamas, TheBahrainBangladeshBarbadosBelarusBelgiumBelizeBeninBhutanBoliviaBosnia and HerzegovinaBotswanaBrazilBulgariaBurkina FasoBurundiCabo VerdeCambodiaCanadaCentral African RepublicChileChinaColombiaCongo, Dem. Rep.Congo, Rep.Costa RicaCote d'IvoireCroatiaCyprusCzech RepublicDenmarkDominicaDominican RepublicEgypt, Arab Rep.El SalvadorEquatorial GuineaEstoniaEthiopiaFijiFinlandFranceGambia, TheGeorgiaGermanyGhanaGreeceGrenadaGuatemalaHondurasHong Kong SAR, ChinaHungaryIcelandIndiaIndonesiaIran, Islamic Rep.IraqIrelandIsraelItalyJamaicaJapanJordanKazakhstanKenyaKiribatiKorea, Rep.KuwaitKyrgyz RepublicLao PDRLatviaLebanonLesothoLiberiaLithuaniaLuxembourgMacao SAR, ChinaMacedonia, FYRMadagascarMalawiMalaysiaMaldivesMaliMaltaMauritiusMexicoMicronesia, Fed. Sts.MoldovaMongoliaMoroccoMozambiqueMyanmarNamibiaNepalNetherlandsNew ZealandNicaraguaNigeriaNorwayOmanPakistanPanamaPapua New GuineaParaguayPeruPhilippinesPolandPortugalQatarRomaniaRussian FederationRwandaSamoaSan MarinoSao Tome and PrincipeSenegalSerbiaSeychellesSierra LeoneSingaporeSlovak RepublicSloveniaSolomon IslandsSouth AfricaSpainSri LankaSt. Kitts and NevisSt. LuciaSt. Vincent and the GrenadinesSurinameSwazilandSwedenSwitzerlandSyrian Arab RepublicTajikistanTanzaniaThailandTimor-LesteTogoTrinidad and TobagoTunisiaTurkeyUgandaUkraineUnited Arab EmiratesUnited KingdomUnited StatesUruguayVanuatuVenezuela, RBVietnamWest Bank and GazaYemen, Rep.ZambiaZimbabwe
La ligne de temps
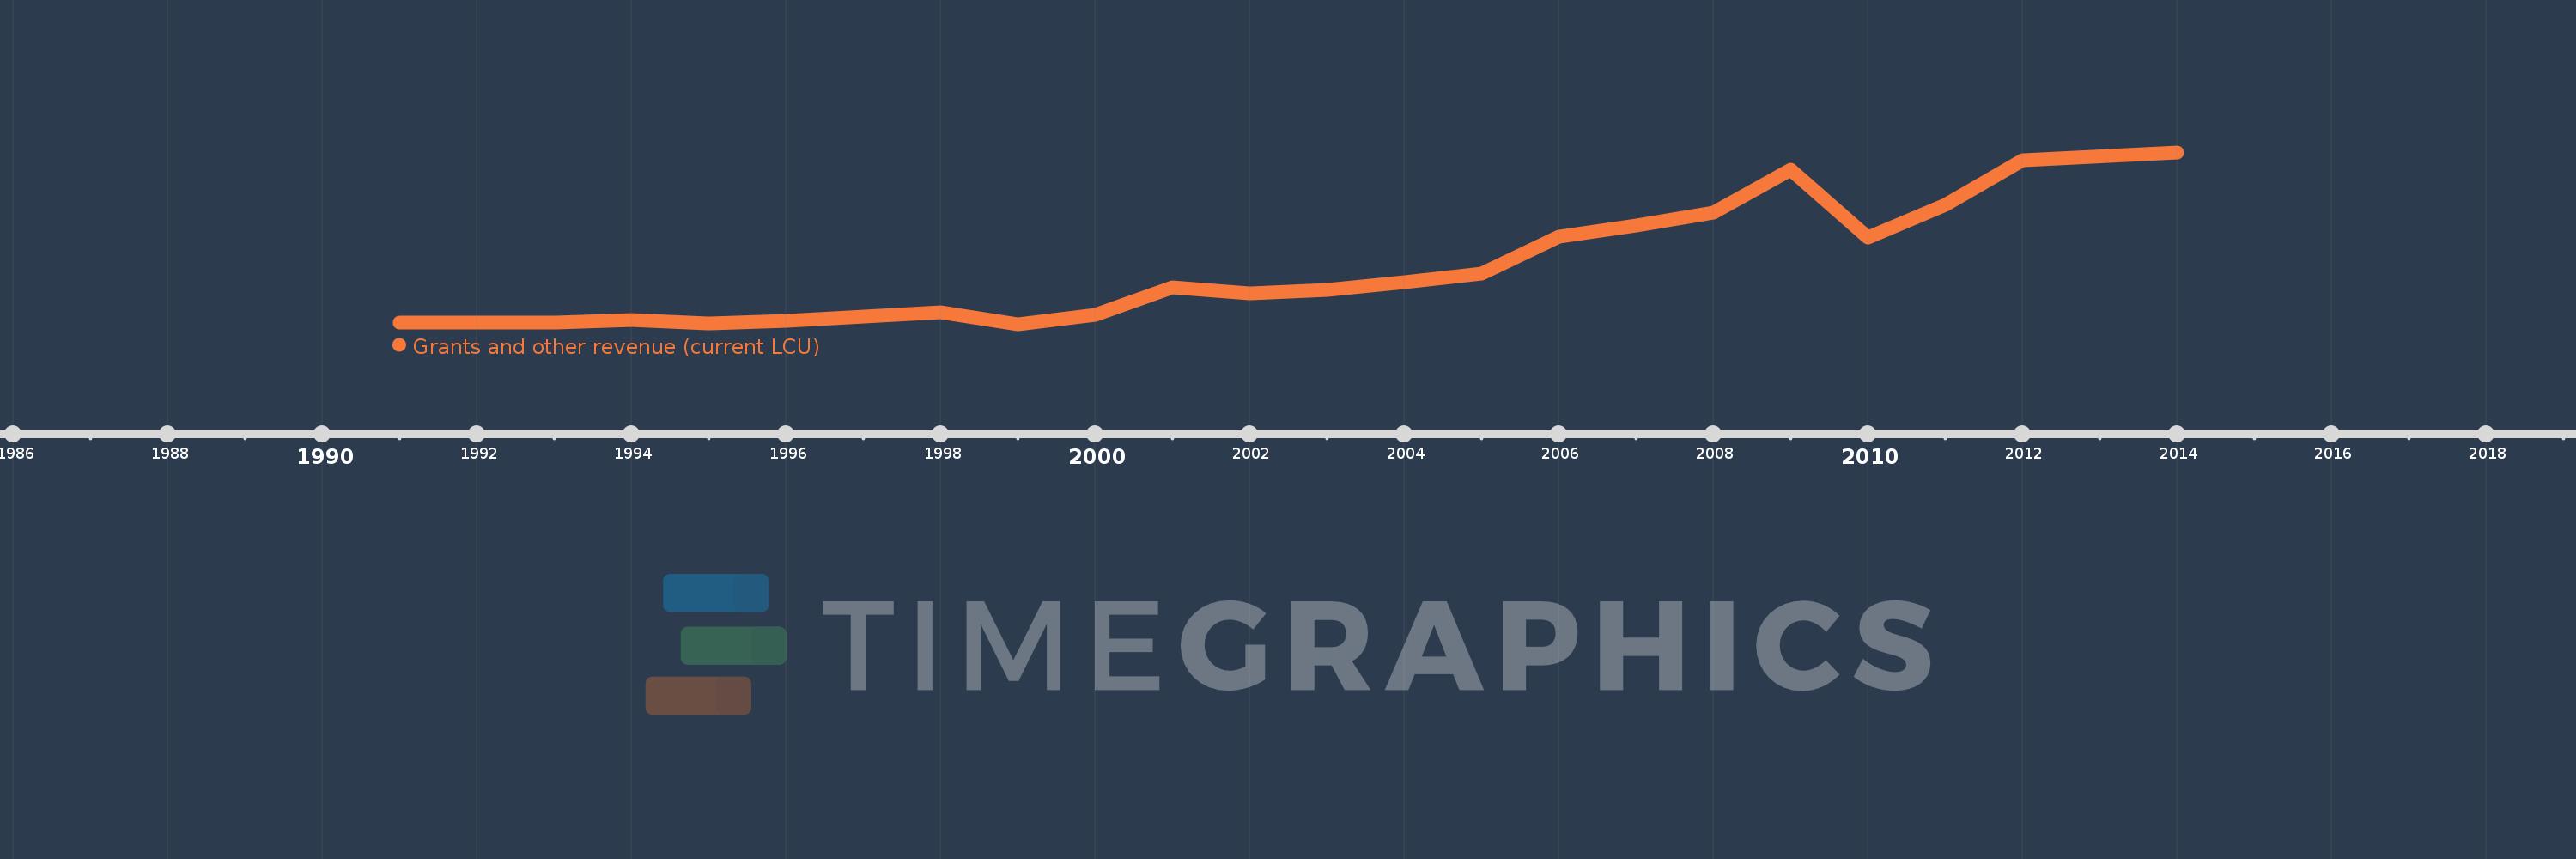
Cette échelle de temps montre un graphique de 1991 année à 2014 année Bahrain. Les données jusqu'à 1990 année ne sont pas présentés. Quantité d'observations actuelles selon dates: 23.
Source (désignation):
Les indicateurs du développement mondiale
Source (organisation):
International Monetary Fund, Government Finance Statistics Yearbook and data files.
Catégories:
Public Sector
Dernière mise à jour
23 avr. 2017
Les indicateurs de changement de valeurs selon les années
En moyenne:
1.116 mds
Minimum:
350.0 mln.
1 janv. 1999
Maximum:
2.811 mds
1 janv. 2014
Pour la date d''observation
Valeur
Changement absolu
Le changement par rapport à la valeur précédente
1 janv. 1991
374.8 mln.
+374.8 mln.
0.0%
1 janv. 1992
379.0 mln.
+4.2 mln.
1.12%
1 janv. 1993
368.5 mln.
-10.5 mln.
-2.77%
1 janv. 1994
411.7 mln.
+43.2 mln.
11.72%
1 janv. 1995
358.9 mln.
-52.8 mln.
-12.82%
1 janv. 1996
394.4 mln.
+35.5 mln.
9.89%
1 janv. 1997
453.9 mln.
+59.5 mln.
15.09%
1 janv. 1998
525.3 mln.
+71.4 mln.
15.73%
1 janv. 1999
350.0 mln.
-175.3 mln.
-33.37%
1 janv. 2000
488.4 mln.
+138.4 mln.
39.54%
1 janv. 2001
876.1 mln.
+387.7 mln.
79.38%
1 janv. 2002
791.4 mln.
-84.7 mln.
-9.67%
1 janv. 2003
843.8 mln.
+52.4 mln.
6.62%
1 janv. 2004
952.1 mln.
+108.3 mln.
12.83%
1 janv. 2005
1.076 mds
+123.5 mln.
12.97%
1 janv. 2006
1.602 mds
+526.04 mln.
48.91%
1 janv. 2007
1.758 mds
+156.76 mln.
9.79%
1 janv. 2008
1.943 mds
+184.739 mln.
10.51%
1 janv. 2009
2.558 mds
+615.041 mln.
31.65%
1 janv. 2010
1.59 mds
-967.77 mln.
-37.83%
1 janv. 2011
2.062 mds
+471.49 mln.
29.65%
1 janv. 2012
2.699 mds
+636.688 mln.
30.88%
1 janv. 2014
2.811 mds
+112.012 mln.
4.15%
Classement des pays selon les statistiques actuelles par années

Commentaires:

Envoyer
PremiumAbout & FeedbackUn accordConfidentialité
logo
© 2022 Selected Technologies LLC – Morgan Hill, California