29
/fr/
fr
AIzaSyAYiBZKx7MnpbEhh9jyipgxe19OcubqV5w
April 1, 2024
171742
Kuwait
KWT
true
2
1
Grants and other revenue (current LCU)
1999,1998,1997,1996,1995,1994,1993,1992,1991,1990,1989,1988,1987,1986,1985,1984,1983,1982,1981,1980,1979,1978,1975,1974,1973
Download
Bibliothèque de statistiques globales →Kuwait →

Grants and other revenue (current LCU)

Cette statistique dans les autres pays:
AfghanistanAlbaniaAlgeriaAngolaAntigua and BarbudaArgentinaArmeniaAustraliaAustriaAzerbaijanBahamas, TheBahrainBangladeshBarbadosBelarusBelgiumBelizeBeninBhutanBoliviaBosnia and HerzegovinaBotswanaBrazilBulgariaBurkina FasoBurundiCabo VerdeCambodiaCanadaCentral African RepublicChileChinaColombiaCongo, Dem. Rep.Congo, Rep.Costa RicaCote d'IvoireCroatiaCyprusCzech RepublicDenmarkDominicaDominican RepublicEgypt, Arab Rep.El SalvadorEquatorial GuineaEstoniaEthiopiaFijiFinlandFranceGambia, TheGeorgiaGermanyGhanaGreeceGrenadaGuatemalaHondurasHong Kong SAR, ChinaHungaryIcelandIndiaIndonesiaIran, Islamic Rep.IraqIrelandIsraelItalyJamaicaJapanJordanKazakhstanKenyaKiribatiKorea, Rep.KuwaitKyrgyz RepublicLao PDRLatviaLebanonLesothoLiberiaLithuaniaLuxembourgMacao SAR, ChinaMacedonia, FYRMadagascarMalawiMalaysiaMaldivesMaliMaltaMauritiusMexicoMicronesia, Fed. Sts.MoldovaMongoliaMoroccoMozambiqueMyanmarNamibiaNepalNetherlandsNew ZealandNicaraguaNigeriaNorwayOmanPakistanPanamaPapua New GuineaParaguayPeruPhilippinesPolandPortugalQatarRomaniaRussian FederationRwandaSamoaSan MarinoSao Tome and PrincipeSenegalSerbiaSeychellesSierra LeoneSingaporeSlovak RepublicSloveniaSolomon IslandsSouth AfricaSpainSri LankaSt. Kitts and NevisSt. LuciaSt. Vincent and the GrenadinesSurinameSwazilandSwedenSwitzerlandSyrian Arab RepublicTajikistanTanzaniaThailandTimor-LesteTogoTrinidad and TobagoTunisiaTurkeyUgandaUkraineUnited Arab EmiratesUnited KingdomUnited StatesUruguayVanuatuVenezuela, RBVietnamWest Bank and GazaYemen, Rep.ZambiaZimbabwe
La ligne de temps
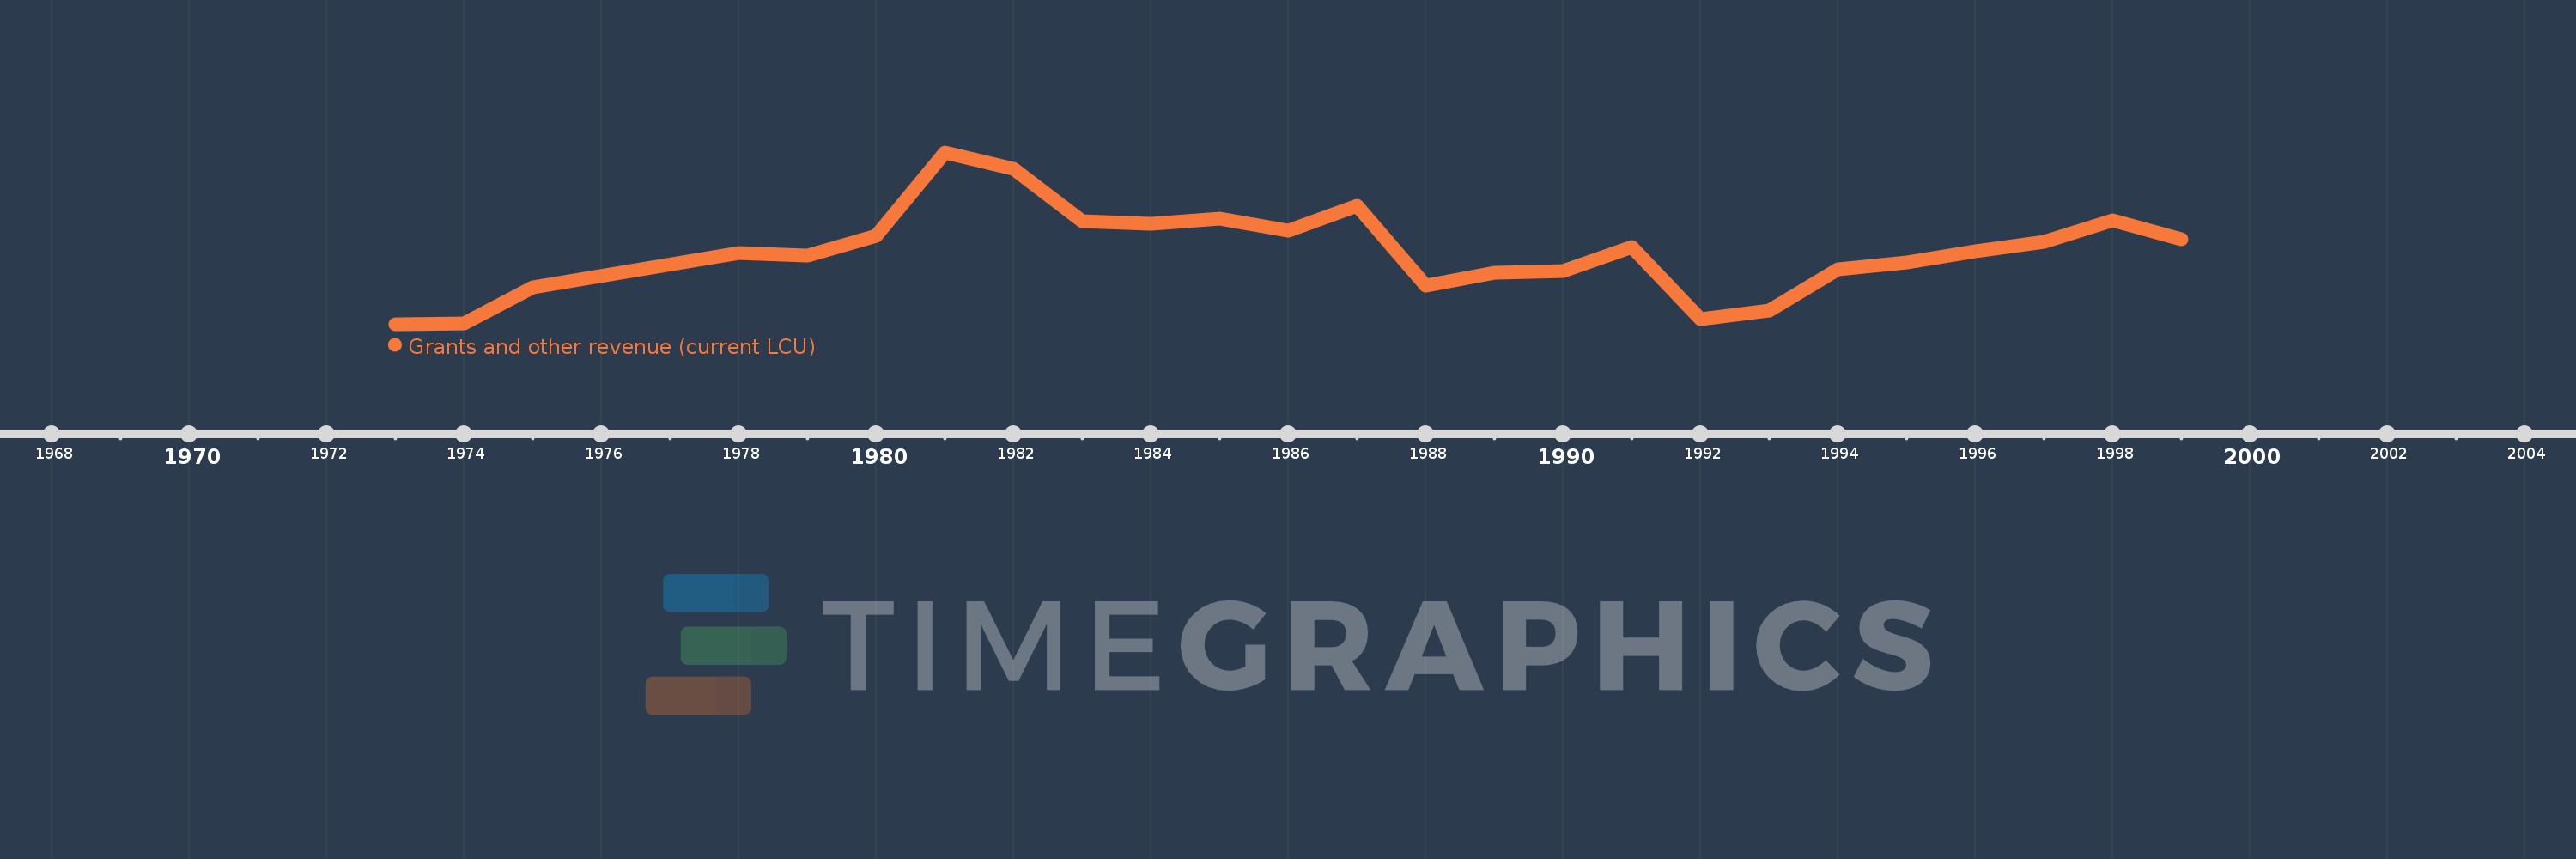
Cette échelle de temps montre un graphique de 1973 année à 1999 année Kuwait. Les données jusqu'à 1972 année ne sont pas présentés. Quantité d'observations actuelles selon dates: 25.
Source (désignation):
Les indicateurs du développement mondiale
Source (organisation):
International Monetary Fund, Government Finance Statistics Yearbook and data files.
Catégories:
Public Sector
Dernière mise à jour
23 avr. 2017
Les indicateurs de changement de valeurs selon les années
En moyenne:
2.868 mds
Minimum:
60.0 mln.
1 janv. 1973
Maximum:
6.707 mds
1 janv. 1981
Pour la date d''observation
Valeur
Changement absolu
Le changement par rapport à la valeur précédente
1 janv. 1973
60.0 mln.
+60.0 mln.
0.0%
1 janv. 1974
97.0 mln.
+37.0 mln.
61.67%
1 janv. 1975
1.478 mds
+1.381 mds
1.42 milles%
1 janv. 1978
2.802 mds
+1.324 mds
89.58%
1 janv. 1979
2.721 mds
-81.0 mln.
-2.89%
1 janv. 1980
3.494 mds
+773.0 mln.
28.41%
1 janv. 1981
6.707 mds
+3.213 mds
91.96%
1 janv. 1982
6.077 mds
-630.0 mln.
-9.39%
1 janv. 1983
4.058 mds
-2.019 mds
-33.22%
1 janv. 1984
3.948 mds
-110.0 mln.
-2.71%
1 janv. 1985
4.157 mds
+209.0 mln.
5.29%
1 janv. 1986
3.669 mds
-488.0 mln.
-11.74%
1 janv. 1987
4.635 mds
+966.0 mln.
26.33%
1 janv. 1988
1.56 mds
-3.075 mds
-66.34%
1 janv. 1989
2.063 mds
+503.0 mln.
32.24%
1 janv. 1990
2.126 mds
+63.0 mln.
3.05%
1 janv. 1991
3.034 mds
+908.0 mln.
42.71%
1 janv. 1992
254.0 mln.
-2.78 mds
-91.63%
1 janv. 1993
580.0 mln.
+326.0 mln.
128.35%
1 janv. 1994
2.188 mds
+1.608 mds
277.24%
1 janv. 1995
2.44 mds
+252.0 mln.
11.52%
1 janv. 1996
2.893 mds
+453.0 mln.
18.57%
1 janv. 1997
3.244 mds
+351.0 mln.
12.13%
1 janv. 1998
4.081 mds
+837.0 mln.
25.8%
1 janv. 1999
3.342 mds
-739.0 mln.
-18.11%
Classement des pays selon les statistiques actuelles par années

Commentaires:

Envoyer
PremiumAbout & FeedbackUn accordConfidentialité
logo
© 2022 Selected Technologies LLC – Morgan Hill, California