29
/de/
de
AIzaSyAYiBZKx7MnpbEhh9jyipgxe19OcubqV5w
April 1, 2024
96121
Burundi
BDI
true
2
1
GDP per person employed (constant 2011 PPP $)
2015,2014,2013,2012,2011,2010,2009,2008,2007,2006,2005,2004,2003,2002,2001,2000,1999,1998,1997,1996,1995,1994,1993,1992
Download
Bibliothek der Globalstatistik →Burundi →

GDP per person employed (constant 2011 PPP $)

Diese Statistik in anderen Ländern:
AfghanistanAlbaniaAlgeriaAngolaArab WorldArgentinaArmeniaAustraliaAustriaAzerbaijanBahamas, TheBahrainBangladeshBarbadosBelarusBelgiumBelizeBeninBhutanBoliviaBosnia and HerzegovinaBotswanaBrazilBrunei DarussalamBulgariaBurkina FasoBurundiCabo VerdeCambodiaCameroonCanadaCaribbean small statesCentral African RepublicCentral Europe and the BalticsChadChileChinaColombiaComorosCongo, Dem. Rep.Congo, Rep.Costa RicaCote d'IvoireCroatiaCubaCyprusCzech RepublicDenmarkDominican RepublicEarly-demographic dividendEast Asia & PacificEast Asia & Pacific (excluding high income)East Asia & Pacific (IDA & IBRD countries)EcuadorEgypt, Arab Rep.El SalvadorEquatorial GuineaEritreaEstoniaEthiopiaEuro areaEurope & Central AsiaEurope & Central Asia (excluding high income)Europe & Central Asia (IDA & IBRD countries)European UnionFijiFinlandFragile and conflict affected situationsFranceGabonGambia, TheGeorgiaGermanyGhanaGreeceGuatemalaGuineaGuinea-BissauGuyanaHaitiHeavily indebted poor countries (HIPC)High incomeHondurasHong Kong SAR, ChinaHungaryIBRD onlyIcelandIDA & IBRD totalIDA blendIDA onlyIDA totalIndiaIndonesiaIran, Islamic Rep.IraqIrelandIsraelItalyJamaicaJapanJordanKazakhstanKenyaKorea, Dem. People’s Rep.Korea, Rep.KuwaitKyrgyz RepublicLao PDRLate-demographic dividendLatin America & Caribbean Latin America & Caribbean (excluding high income)Latin America & the Caribbean (IDA & IBRD countries)LatviaLeast developed countries: UN classificationLebanonLesothoLiberiaLibyaLithuaniaLow & middle incomeLow incomeLower middle incomeLuxembourgMacao SAR, ChinaMacedonia, FYRMadagascarMalawiMalaysiaMaldivesMaliMaltaMauritaniaMauritiusMexicoMiddle East & North AfricaMiddle East & North Africa (excluding high income)Middle East & North Africa (IDA & IBRD countries)Middle incomeMoldovaMongoliaMontenegroMoroccoMozambiqueMyanmarNamibiaNepalNetherlandsNew ZealandNicaraguaNigerNigeriaNorth AmericaNorwayOECD membersOmanOther small statesPakistanPanamaPapua New GuineaParaguayPeruPhilippinesPolandPortugalPost-demographic dividendPre-demographic dividendPuerto RicoQatarRomaniaRussian FederationRwandaSaudi ArabiaSenegalSerbiaSierra LeoneSingaporeSlovak RepublicSloveniaSmall statesSolomon IslandsSomaliaSouth AfricaSouth AsiaSouth Asia (IDA & IBRD)SpainSri LankaSub-Saharan Africa Sub-Saharan Africa (excluding high income)Sub-Saharan Africa (IDA & IBRD countries)SudanSurinameSwazilandSwedenSwitzerlandSyrian Arab RepublicTajikistanTanzaniaThailandTimor-LesteTogoTrinidad and TobagoTunisiaTurkeyTurkmenistanUgandaUkraineUnited Arab EmiratesUnited KingdomUnited StatesUpper middle incomeUruguayUzbekistanVenezuela, RBVietnamWest Bank and GazaWorldYemen, Rep.ZambiaZimbabwe
Zeitlinie:
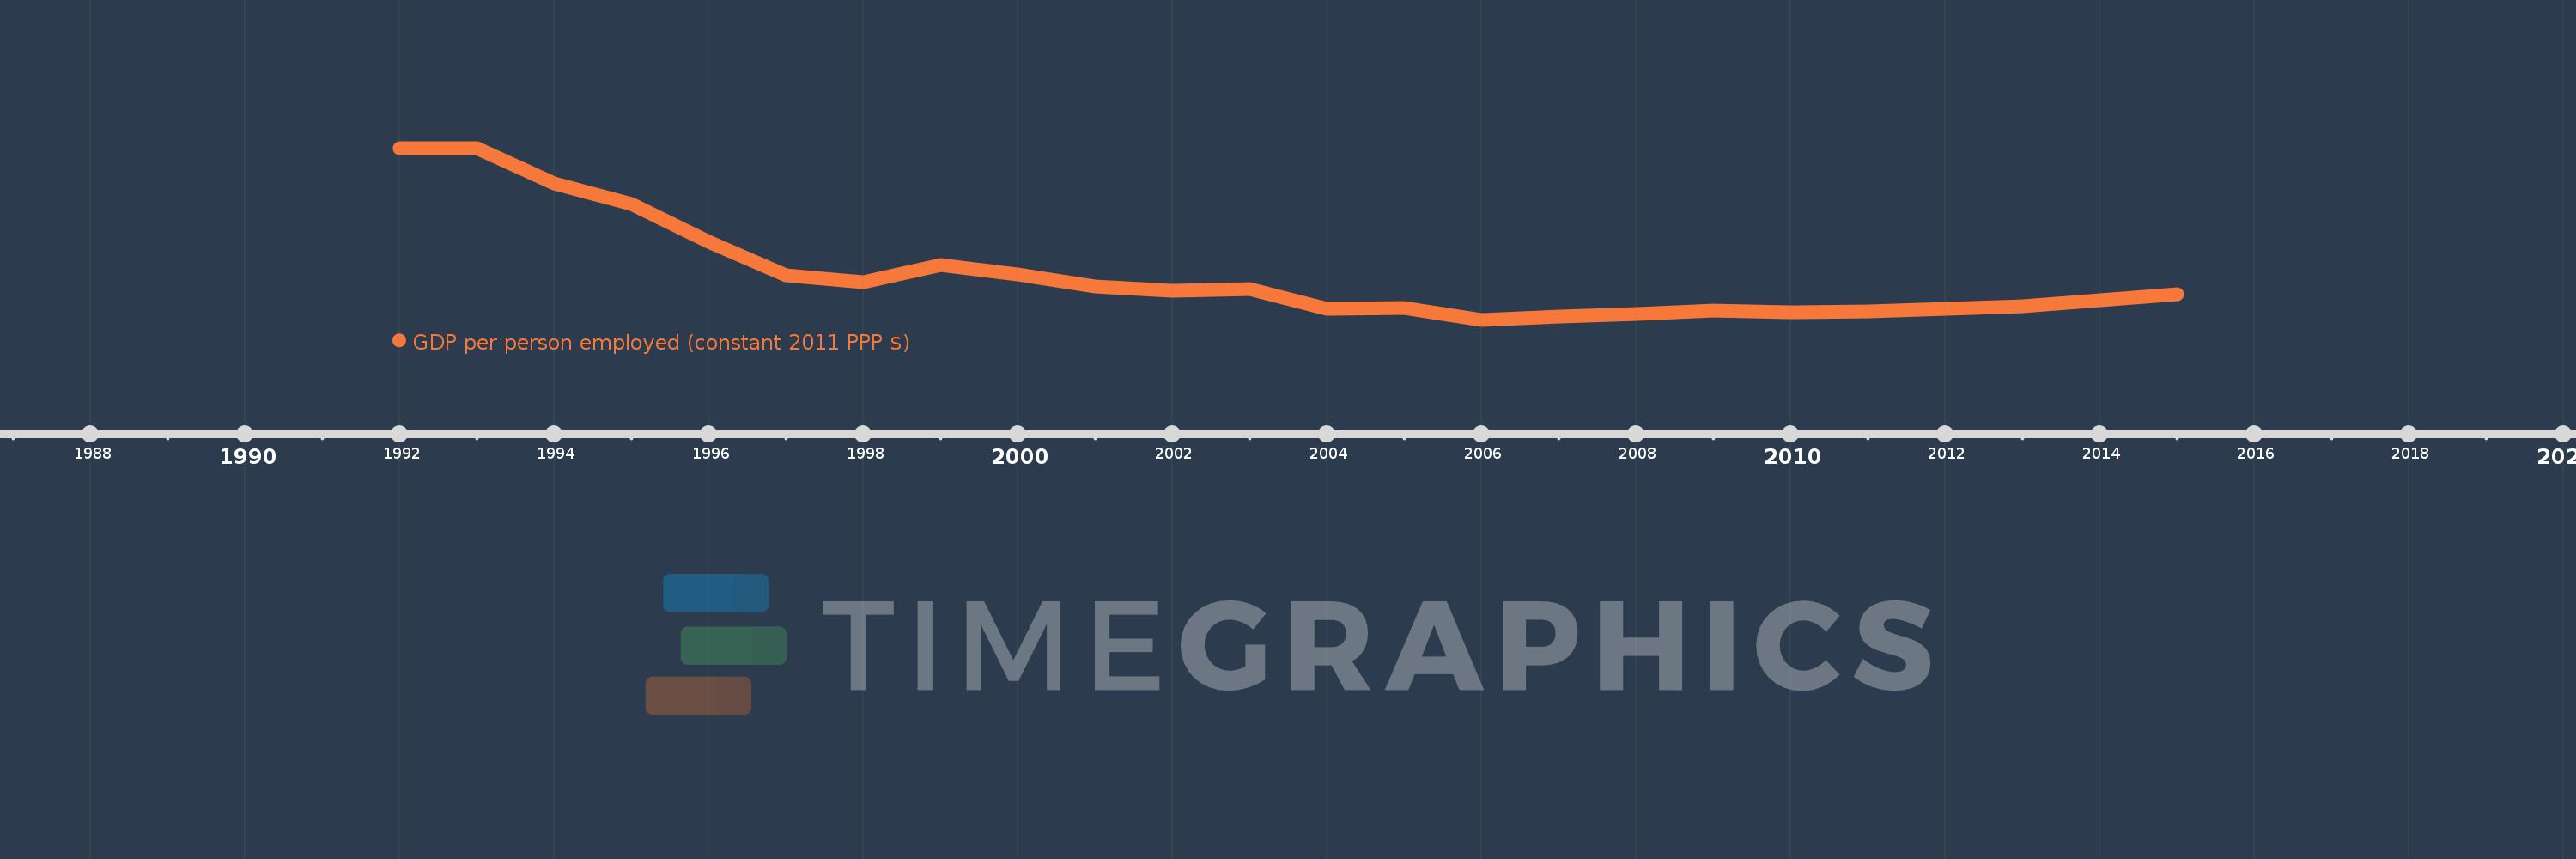
Diese Zeitleiste vorliegt die Graphik ab 1992 J. bis 2015 J. Burundi. Die Angaben bis 1991 J. sind nicht vorhanden. Die Zahl aktueller Beobachtungen nach Daten: 24.
Die Quelle (Bezeichnung):
Kennzahlen der Weltentwicklung
Die Quelle (Einrichtung):
International Labour Organization, Key Indicators of the Labour Market database.
Kategorien:
Social Protection & Labor
Es wurde aktualisiert:
23 Apr 2017 Jahr
Kennzahlen der Wertänderungen vom Jahr zum Jahr
im Durchschnitt:
1.87 Tsnd.
Minimum:
1.654 Tsnd.
1 Jan 2006 Jahr
Maximum:
2.482 Tsnd.
1 Jan 1993 Jahr
Zum Datum der Beobachtung
Wert
Absolute Veränderung
Die Veränderung bezüglich dem vorherigen Wert
1 Jan 1992 Jahr
2.478 Tsnd.
+2.478 Tsnd.
0.0%
1 Jan 1993 Jahr
2.482 Tsnd.
+3.15
0.13%
1 Jan 1994 Jahr
2.312 Tsnd.
-169.54
-6.83%
1 Jan 1995 Jahr
2.212 Tsnd.
-99.9
-4.32%
1 Jan 1996 Jahr
2.031 Tsnd.
-180.78
-8.17%
1 Jan 1997 Jahr
1.867 Tsnd.
-164.7
-8.11%
1 Jan 1998 Jahr
1.835 Tsnd.
-31.83
-1.71%
1 Jan 1999 Jahr
1.917 Tsnd.
+82.65
4.5%
1 Jan 2000 Jahr
1.872 Tsnd.
-45.63
-2.38%
1 Jan 2001 Jahr
1.814 Tsnd.
-57.88
-3.09%
1 Jan 2002 Jahr
1.793 Tsnd.
-20.67
-1.14%
1 Jan 2003 Jahr
1.803 Tsnd.
+9.52
0.53%
1 Jan 2004 Jahr
1.706 Tsnd.
-96.78
-5.37%
1 Jan 2005 Jahr
1.711 Tsnd.
+5.48
0.32%
1 Jan 2006 Jahr
1.654 Tsnd.
-57.39
-3.35%
1 Jan 2007 Jahr
1.671 Tsnd.
+17.07
1.03%
1 Jan 2008 Jahr
1.681 Tsnd.
+9.58
0.57%
1 Jan 2009 Jahr
1.696 Tsnd.
+15.68
0.93%
1 Jan 2010 Jahr
1.69 Tsnd.
-6.0
-0.35%
1 Jan 2011 Jahr
1.693 Tsnd.
+2.36
0.14%
1 Jan 2012 Jahr
1.706 Tsnd.
+13.17
0.78%
1 Jan 2013 Jahr
1.721 Tsnd.
+15.12
0.89%
1 Jan 2014 Jahr
1.747 Tsnd.
+25.99
1.51%
1 Jan 2015 Jahr
1.779 Tsnd.
+31.53
1.8%
Bewertung der Länder gemäß mit laufender Statistik nach Jahren

Kommentare:

Abschicken
PremiumAbout & FeedbackVereinbarungPrivatheit
logo
© 2022 Selected Technologies LLC – Morgan Hill, California