29
/de/
de
AIzaSyAYiBZKx7MnpbEhh9jyipgxe19OcubqV5w
April 1, 2024
205270
Namibia
NAM
true
2
1
GDP per person employed (constant 2011 PPP $)
2015,2014,2013,2012,2011,2010,2009,2008,2007,2006,2005,2004,2003,2002,2001,2000,1999,1998,1997,1996,1995,1994,1993,1992
Download
Bibliothek der Globalstatistik →Namibia →

GDP per person employed (constant 2011 PPP $)

Diese Statistik in anderen Ländern:
AfghanistanAlbaniaAlgeriaAngolaArab WorldArgentinaArmeniaAustraliaAustriaAzerbaijanBahamas, TheBahrainBangladeshBarbadosBelarusBelgiumBelizeBeninBhutanBoliviaBosnia and HerzegovinaBotswanaBrazilBrunei DarussalamBulgariaBurkina FasoBurundiCabo VerdeCambodiaCameroonCanadaCaribbean small statesCentral African RepublicCentral Europe and the BalticsChadChileChinaColombiaComorosCongo, Dem. Rep.Congo, Rep.Costa RicaCote d'IvoireCroatiaCubaCyprusCzech RepublicDenmarkDominican RepublicEarly-demographic dividendEast Asia & PacificEast Asia & Pacific (excluding high income)East Asia & Pacific (IDA & IBRD countries)EcuadorEgypt, Arab Rep.El SalvadorEquatorial GuineaEritreaEstoniaEthiopiaEuro areaEurope & Central AsiaEurope & Central Asia (excluding high income)Europe & Central Asia (IDA & IBRD countries)European UnionFijiFinlandFragile and conflict affected situationsFranceGabonGambia, TheGeorgiaGermanyGhanaGreeceGuatemalaGuineaGuinea-BissauGuyanaHaitiHeavily indebted poor countries (HIPC)High incomeHondurasHong Kong SAR, ChinaHungaryIBRD onlyIcelandIDA & IBRD totalIDA blendIDA onlyIDA totalIndiaIndonesiaIran, Islamic Rep.IraqIrelandIsraelItalyJamaicaJapanJordanKazakhstanKenyaKorea, Dem. People’s Rep.Korea, Rep.KuwaitKyrgyz RepublicLao PDRLate-demographic dividendLatin America & Caribbean Latin America & Caribbean (excluding high income)Latin America & the Caribbean (IDA & IBRD countries)LatviaLeast developed countries: UN classificationLebanonLesothoLiberiaLibyaLithuaniaLow & middle incomeLow incomeLower middle incomeLuxembourgMacao SAR, ChinaMacedonia, FYRMadagascarMalawiMalaysiaMaldivesMaliMaltaMauritaniaMauritiusMexicoMiddle East & North AfricaMiddle East & North Africa (excluding high income)Middle East & North Africa (IDA & IBRD countries)Middle incomeMoldovaMongoliaMontenegroMoroccoMozambiqueMyanmarNamibiaNepalNetherlandsNew ZealandNicaraguaNigerNigeriaNorth AmericaNorwayOECD membersOmanOther small statesPakistanPanamaPapua New GuineaParaguayPeruPhilippinesPolandPortugalPost-demographic dividendPre-demographic dividendPuerto RicoQatarRomaniaRussian FederationRwandaSaudi ArabiaSenegalSerbiaSierra LeoneSingaporeSlovak RepublicSloveniaSmall statesSolomon IslandsSomaliaSouth AfricaSouth AsiaSouth Asia (IDA & IBRD)SpainSri LankaSub-Saharan Africa Sub-Saharan Africa (excluding high income)Sub-Saharan Africa (IDA & IBRD countries)SudanSurinameSwazilandSwedenSwitzerlandSyrian Arab RepublicTajikistanTanzaniaThailandTimor-LesteTogoTrinidad and TobagoTunisiaTurkeyTurkmenistanUgandaUkraineUnited Arab EmiratesUnited KingdomUnited StatesUpper middle incomeUruguayUzbekistanVenezuela, RBVietnamWest Bank and GazaWorldYemen, Rep.ZambiaZimbabwe
Zeitlinie:
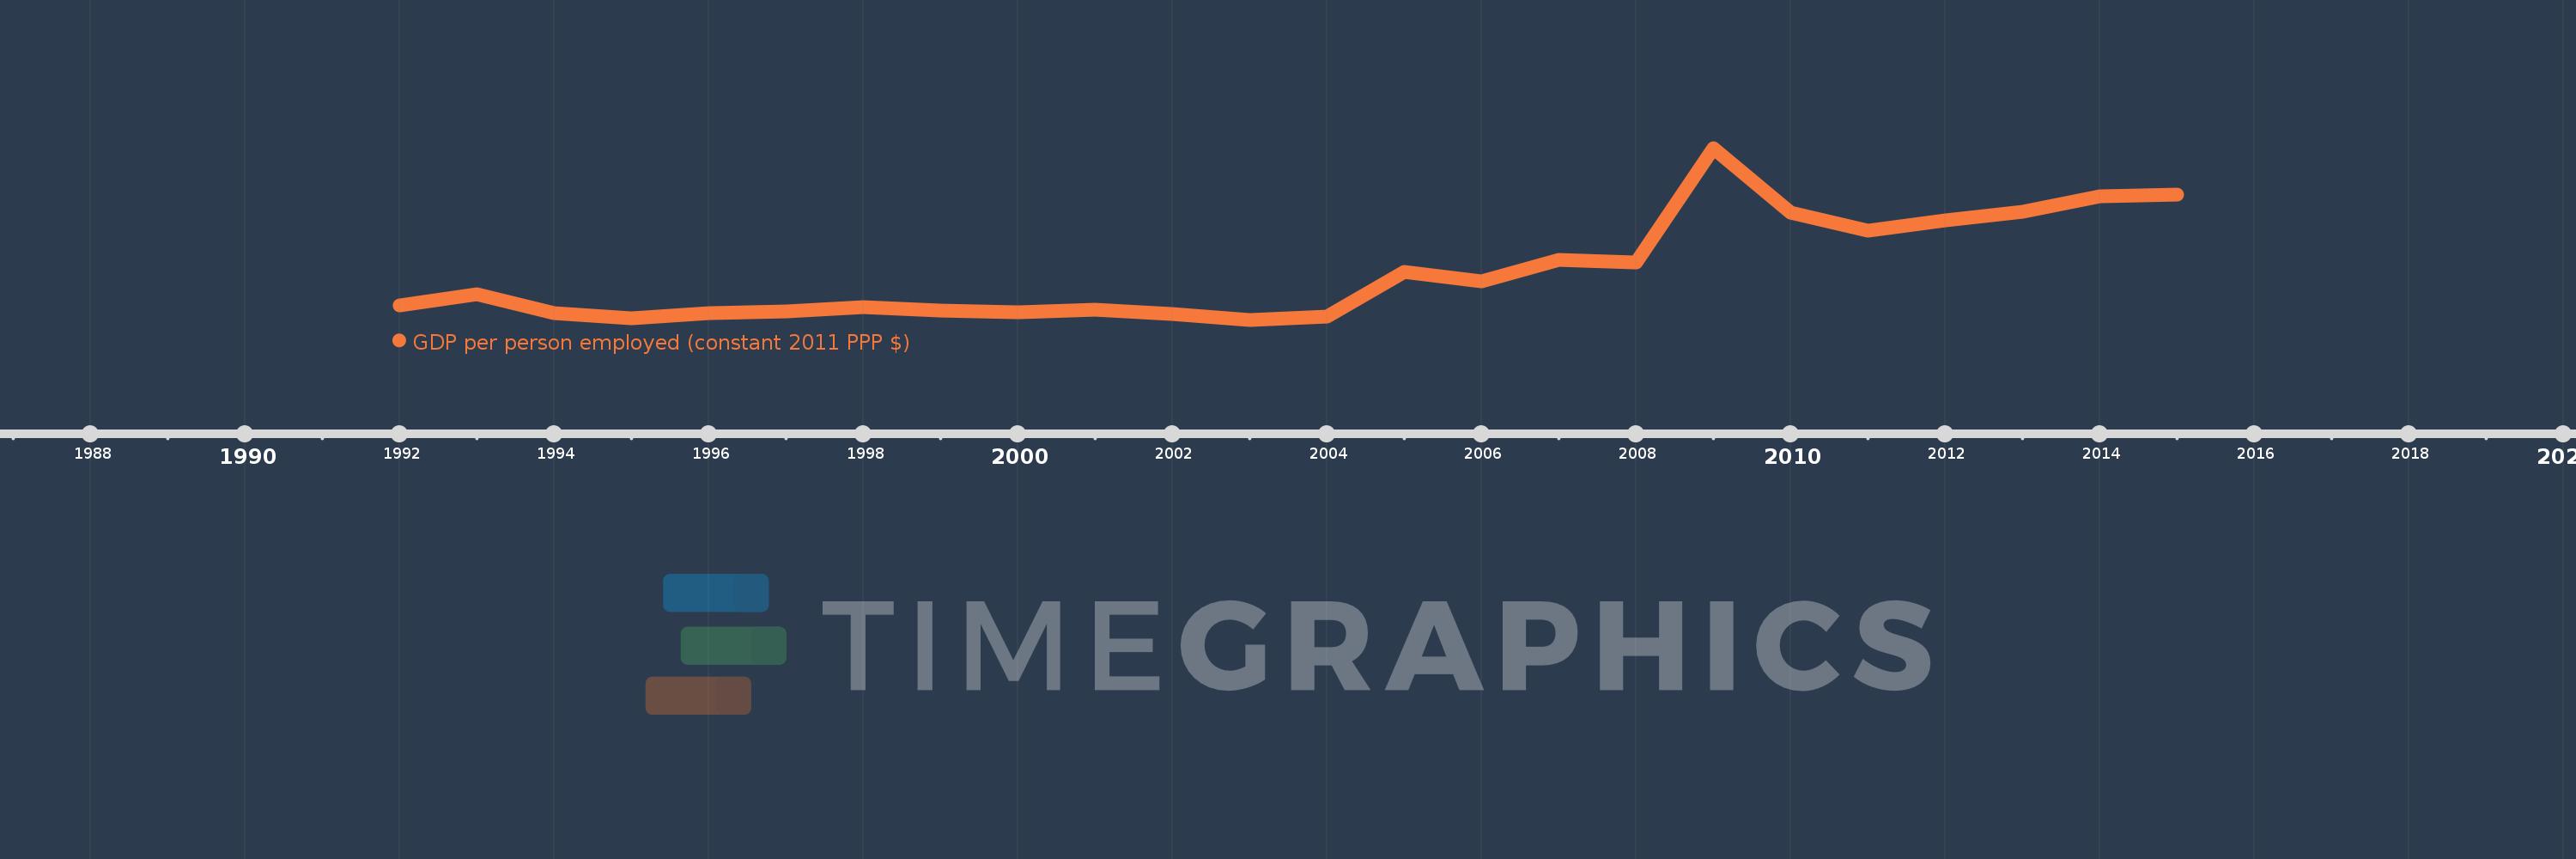
Diese Zeitleiste vorliegt die Graphik ab 1992 J. bis 2015 J. Namibia. Die Angaben bis 1991 J. sind nicht vorhanden. Die Zahl aktueller Beobachtungen nach Daten: 24.
Die Quelle (Bezeichnung):
Kennzahlen der Weltentwicklung
Die Quelle (Einrichtung):
International Labour Organization, Key Indicators of the Labour Market database.
Kategorien:
Social Protection & Labor
Es wurde aktualisiert:
23 Apr 2017 Jahr
Kennzahlen der Wertänderungen vom Jahr zum Jahr
im Durchschnitt:
25.482 Tsnd.
Minimum:
22.275 Tsnd.
1 Jan 2003 Jahr
Maximum:
33.875 Tsnd.
1 Jan 2009 Jahr
Zum Datum der Beobachtung
Wert
Absolute Veränderung
Die Veränderung bezüglich dem vorherigen Wert
1 Jan 1992 Jahr
23.259 Tsnd.
+23.259 Tsnd.
0.0%
1 Jan 1993 Jahr
23.982 Tsnd.
+723.012
3.11%
1 Jan 1994 Jahr
22.738 Tsnd.
-1.244 Tsnd.
-5.19%
1 Jan 1995 Jahr
22.366 Tsnd.
-372.24
-1.64%
1 Jan 1996 Jahr
22.701 Tsnd.
+335.371
1.5%
1 Jan 1997 Jahr
22.845 Tsnd.
+144.109
0.63%
1 Jan 1998 Jahr
23.132 Tsnd.
+286.789
1.26%
1 Jan 1999 Jahr
22.891 Tsnd.
-240.398
-1.04%
1 Jan 2000 Jahr
22.802 Tsnd.
-89.191
-0.39%
1 Jan 2001 Jahr
22.949 Tsnd.
+147.221
0.65%
1 Jan 2002 Jahr
22.641 Tsnd.
-307.939
-1.34%
1 Jan 2003 Jahr
22.275 Tsnd.
-366.621
-1.62%
1 Jan 2004 Jahr
22.491 Tsnd.
+216.271
0.97%
1 Jan 2005 Jahr
25.517 Tsnd.
+3.026 Tsnd.
13.46%
1 Jan 2006 Jahr
24.892 Tsnd.
-625.49
-2.45%
1 Jan 2007 Jahr
26.344 Tsnd.
+1.452 Tsnd.
5.83%
1 Jan 2008 Jahr
26.116 Tsnd.
-227.359
-0.86%
1 Jan 2009 Jahr
33.875 Tsnd.
+7.758 Tsnd.
29.71%
1 Jan 2010 Jahr
29.531 Tsnd.
-4.344 Tsnd.
-12.82%
1 Jan 2011 Jahr
28.268 Tsnd.
-1.263 Tsnd.
-4.28%
1 Jan 2012 Jahr
28.982 Tsnd.
+713.92
2.53%
1 Jan 2013 Jahr
29.594 Tsnd.
+612.01
2.11%
1 Jan 2014 Jahr
30.634 Tsnd.
+1.041 Tsnd.
3.52%
1 Jan 2015 Jahr
30.734 Tsnd.
+99.109
0.32%
Bewertung der Länder gemäß mit laufender Statistik nach Jahren

Kommentare:

Abschicken
PremiumAbout & FeedbackVereinbarungPrivatheit
logo
© 2022 Selected Technologies LLC – Morgan Hill, California