33
/de/
AIzaSyAYiBZKx7MnpbEhh9jyipgxe19OcubqV5w
August 1, 2025
62601
World
WLD
false
2
1
GDP per person employed (constant 2011 PPP $)
2015,2014,2013,2012,2011,2010,2009,2008,2007,2006,2005,2004,2003,2002,2001,2000,1999,1998,1997,1996,1995,1994,1993,1992
Download
Bibliothek der Globalstatistik →World →

GDP per person employed (constant 2011 PPP $)

Diese Statistik in anderen Ländern:

AfghanistanAlbaniaAlgeriaAngolaArab WorldArgentinaArmeniaAustraliaAustriaAzerbaijanBahamas, TheBahrainBangladeshBarbadosBelarusBelgiumBelizeBeninBhutanBoliviaBosnia and HerzegovinaBotswanaBrazilBrunei DarussalamBulgariaBurkina FasoBurundiCabo VerdeCambodiaCameroonCanadaCaribbean small statesCentral African RepublicCentral Europe and the BalticsChadChileChinaColombiaComorosCongo, Dem. Rep.Congo, Rep.Costa RicaCote d'IvoireCroatiaCubaCyprusCzech RepublicDenmarkDominican RepublicEarly-demographic dividendEast Asia & PacificEast Asia & Pacific (excluding high income)East Asia & Pacific (IDA & IBRD countries)EcuadorEgypt, Arab Rep.El SalvadorEquatorial GuineaEritreaEstoniaEthiopiaEuro areaEurope & Central AsiaEurope & Central Asia (excluding high income)Europe & Central Asia (IDA & IBRD countries)European UnionFijiFinlandFragile and conflict affected situationsFranceGabonGambia, TheGeorgiaGermanyGhanaGreeceGuatemalaGuineaGuinea-BissauGuyanaHaitiHeavily indebted poor countries (HIPC)High incomeHondurasHong Kong SAR, ChinaHungaryIBRD onlyIcelandIDA & IBRD totalIDA blendIDA onlyIDA totalIndiaIndonesiaIran, Islamic Rep.IraqIrelandIsraelItalyJamaicaJapanJordanKazakhstanKenyaKorea, Dem. People’s Rep.Korea, Rep.KuwaitKyrgyz RepublicLao PDRLate-demographic dividendLatin America & Caribbean Latin America & Caribbean (excluding high income)Latin America & the Caribbean (IDA & IBRD countries)LatviaLeast developed countries: UN classificationLebanonLesothoLiberiaLibyaLithuaniaLow & middle incomeLow incomeLower middle incomeLuxembourgMacao SAR, ChinaMacedonia, FYRMadagascarMalawiMalaysiaMaldivesMaliMaltaMauritaniaMauritiusMexicoMiddle East & North AfricaMiddle East & North Africa (excluding high income)Middle East & North Africa (IDA & IBRD countries)Middle incomeMoldovaMongoliaMontenegroMoroccoMozambiqueMyanmarNamibiaNepalNetherlandsNew ZealandNicaraguaNigerNigeriaNorth AmericaNorwayOECD membersOmanOther small statesPakistanPanamaPapua New GuineaParaguayPeruPhilippinesPolandPortugalPost-demographic dividendPre-demographic dividendPuerto RicoQatarRomaniaRussian FederationRwandaSaudi ArabiaSenegalSerbiaSierra LeoneSingaporeSlovak RepublicSloveniaSmall statesSolomon IslandsSomaliaSouth AfricaSouth AsiaSouth Asia (IDA & IBRD)SpainSri LankaSub-Saharan Africa Sub-Saharan Africa (excluding high income)Sub-Saharan Africa (IDA & IBRD countries)SudanSurinameSwazilandSwedenSwitzerlandSyrian Arab RepublicTajikistanTanzaniaThailandTimor-LesteTogoTrinidad and TobagoTunisiaTurkeyTurkmenistanUgandaUkraineUnited Arab EmiratesUnited KingdomUnited StatesUpper middle incomeUruguayUzbekistanVenezuela, RBVietnamWest Bank and GazaWorldYemen, Rep.ZambiaZimbabwe

Zeitlinie:

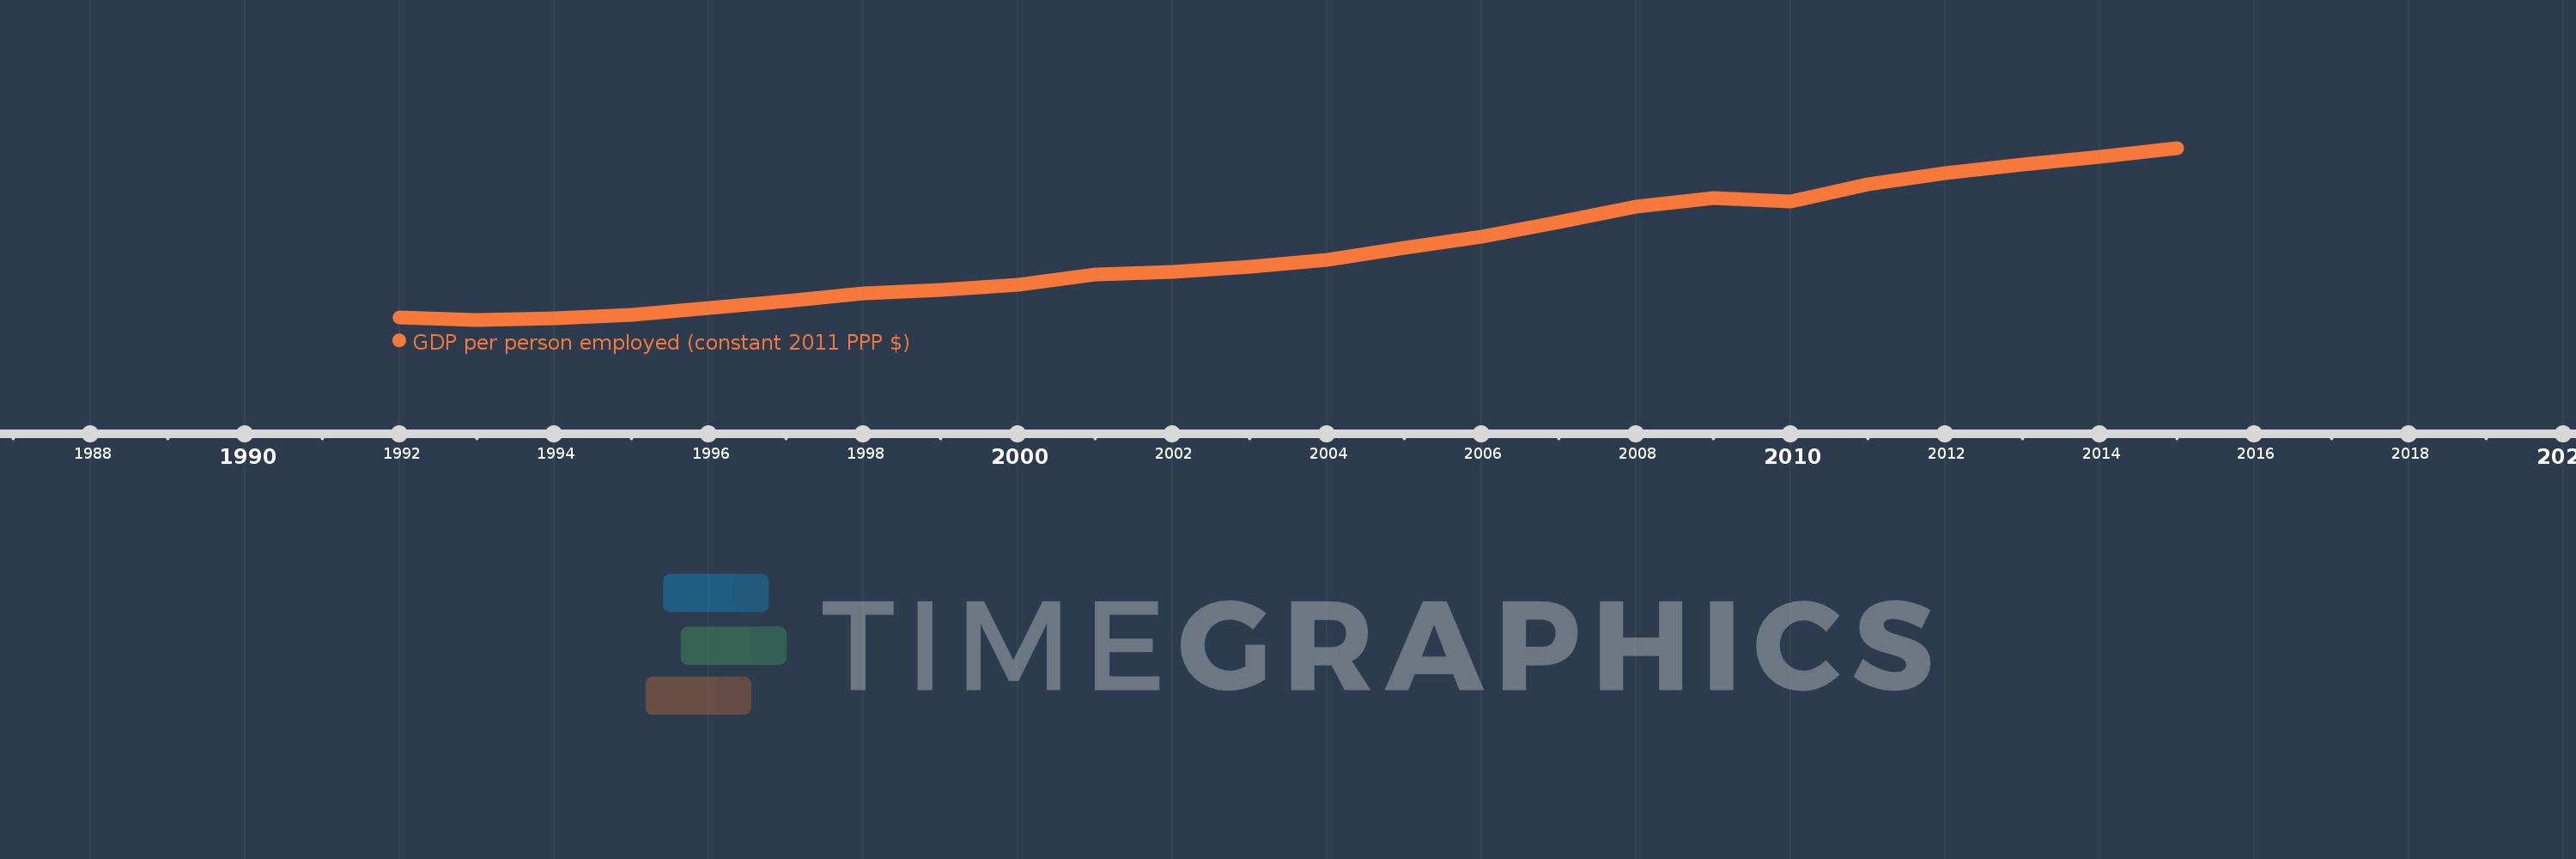
Diese Zeitleiste vorliegt die Graphik ab 1992 J. bis 2015 J. World. Die Angaben bis 1991 J. sind nicht vorhanden. Die Zahl aktueller Beobachtungen nach Daten: 24.

Die Quelle (Bezeichnung):

Kennzahlen der Weltentwicklung

Die Quelle (Einrichtung):

International Labour Organization, Key Indicators of the Labour Market database.

Kategorien:

Social Protection & Labor

Es wurde aktualisiert:

23 Apr 2017 Jahr

Kennzahlen der Wertänderungen vom Jahr zum Jahr

im Durchschnitt:
25.335 Tsnd.
Minimum:
20.64 Tsnd.
1 Jan 1993 Jahr
Maximum:
31.934 Tsnd.
1 Jan 2015 Jahr
Zum Datum der Beobachtung
Wert
Absolute Veränderung
Die Veränderung bezüglich dem vorherigen Wert
1 Jan 1992 Jahr
20.784 Tsnd.
+20.784 Tsnd.
0.0%
1 Jan 1993 Jahr
20.64 Tsnd.
-144.11
-0.69%
1 Jan 1994 Jahr
20.714 Tsnd.
+74.205
0.36%
1 Jan 1995 Jahr
20.968 Tsnd.
+253.34
1.22%
1 Jan 1996 Jahr
21.391 Tsnd.
+423.751
2.02%
1 Jan 1997 Jahr
21.849 Tsnd.
+457.083
2.14%
1 Jan 1998 Jahr
22.381 Tsnd.
+532.902
2.44%
1 Jan 1999 Jahr
22.602 Tsnd.
+220.418
0.98%
1 Jan 2000 Jahr
22.96 Tsnd.
+358.46
1.59%
1 Jan 2001 Jahr
23.615 Tsnd.
+654.76
2.85%
1 Jan 2002 Jahr
23.809 Tsnd.
+194.115
0.82%
1 Jan 2003 Jahr
24.097 Tsnd.
+287.619
1.21%
1 Jan 2004 Jahr
24.549 Tsnd.
+452.486
1.88%
1 Jan 2005 Jahr
25.391 Tsnd.
+842.021
3.43%
1 Jan 2006 Jahr
26.093 Tsnd.
+701.329
2.76%
1 Jan 2007 Jahr
27.08 Tsnd.
+987.104
3.78%
1 Jan 2008 Jahr
28.082 Tsnd.
+1.002 Tsnd.
3.7%
1 Jan 2009 Jahr
28.621 Tsnd.
+538.418
1.92%
1 Jan 2010 Jahr
28.43 Tsnd.
-190.341
-0.67%
1 Jan 2011 Jahr
29.548 Tsnd.
+1.117 Tsnd.
3.93%
1 Jan 2012 Jahr
30.267 Tsnd.
+719.181
2.43%
1 Jan 2013 Jahr
30.856 Tsnd.
+589.16
1.95%
1 Jan 2014 Jahr
31.377 Tsnd.
+521.309
1.69%
1 Jan 2015 Jahr
31.934 Tsnd.
+556.834
1.77%

Bewertung der Länder gemäß mit laufender Statistik nach Jahren