29
/de/
de
AIzaSyAYiBZKx7MnpbEhh9jyipgxe19OcubqV5w
April 1, 2024
163761
Japan
JPN
true
2
1
GDP per person employed (constant 2011 PPP $)
2015,2014,2013,2012,2011,2010,2009,2008,2007,2006,2005,2004,2003,2002,2001,2000,1999,1998,1997,1996,1995,1994,1993,1992
Download
Bibliothek der Globalstatistik →Japan →

GDP per person employed (constant 2011 PPP $)

Diese Statistik in anderen Ländern:
AfghanistanAlbaniaAlgeriaAngolaArab WorldArgentinaArmeniaAustraliaAustriaAzerbaijanBahamas, TheBahrainBangladeshBarbadosBelarusBelgiumBelizeBeninBhutanBoliviaBosnia and HerzegovinaBotswanaBrazilBrunei DarussalamBulgariaBurkina FasoBurundiCabo VerdeCambodiaCameroonCanadaCaribbean small statesCentral African RepublicCentral Europe and the BalticsChadChileChinaColombiaComorosCongo, Dem. Rep.Congo, Rep.Costa RicaCote d'IvoireCroatiaCubaCyprusCzech RepublicDenmarkDominican RepublicEarly-demographic dividendEast Asia & PacificEast Asia & Pacific (excluding high income)East Asia & Pacific (IDA & IBRD countries)EcuadorEgypt, Arab Rep.El SalvadorEquatorial GuineaEritreaEstoniaEthiopiaEuro areaEurope & Central AsiaEurope & Central Asia (excluding high income)Europe & Central Asia (IDA & IBRD countries)European UnionFijiFinlandFragile and conflict affected situationsFranceGabonGambia, TheGeorgiaGermanyGhanaGreeceGuatemalaGuineaGuinea-BissauGuyanaHaitiHeavily indebted poor countries (HIPC)High incomeHondurasHong Kong SAR, ChinaHungaryIBRD onlyIcelandIDA & IBRD totalIDA blendIDA onlyIDA totalIndiaIndonesiaIran, Islamic Rep.IraqIrelandIsraelItalyJamaicaJapanJordanKazakhstanKenyaKorea, Dem. People’s Rep.Korea, Rep.KuwaitKyrgyz RepublicLao PDRLate-demographic dividendLatin America & Caribbean Latin America & Caribbean (excluding high income)Latin America & the Caribbean (IDA & IBRD countries)LatviaLeast developed countries: UN classificationLebanonLesothoLiberiaLibyaLithuaniaLow & middle incomeLow incomeLower middle incomeLuxembourgMacao SAR, ChinaMacedonia, FYRMadagascarMalawiMalaysiaMaldivesMaliMaltaMauritaniaMauritiusMexicoMiddle East & North AfricaMiddle East & North Africa (excluding high income)Middle East & North Africa (IDA & IBRD countries)Middle incomeMoldovaMongoliaMontenegroMoroccoMozambiqueMyanmarNamibiaNepalNetherlandsNew ZealandNicaraguaNigerNigeriaNorth AmericaNorwayOECD membersOmanOther small statesPakistanPanamaPapua New GuineaParaguayPeruPhilippinesPolandPortugalPost-demographic dividendPre-demographic dividendPuerto RicoQatarRomaniaRussian FederationRwandaSaudi ArabiaSenegalSerbiaSierra LeoneSingaporeSlovak RepublicSloveniaSmall statesSolomon IslandsSomaliaSouth AfricaSouth AsiaSouth Asia (IDA & IBRD)SpainSri LankaSub-Saharan Africa Sub-Saharan Africa (excluding high income)Sub-Saharan Africa (IDA & IBRD countries)SudanSurinameSwazilandSwedenSwitzerlandSyrian Arab RepublicTajikistanTanzaniaThailandTimor-LesteTogoTrinidad and TobagoTunisiaTurkeyTurkmenistanUgandaUkraineUnited Arab EmiratesUnited KingdomUnited StatesUpper middle incomeUruguayUzbekistanVenezuela, RBVietnamWest Bank and GazaWorldYemen, Rep.ZambiaZimbabwe
Zeitlinie:
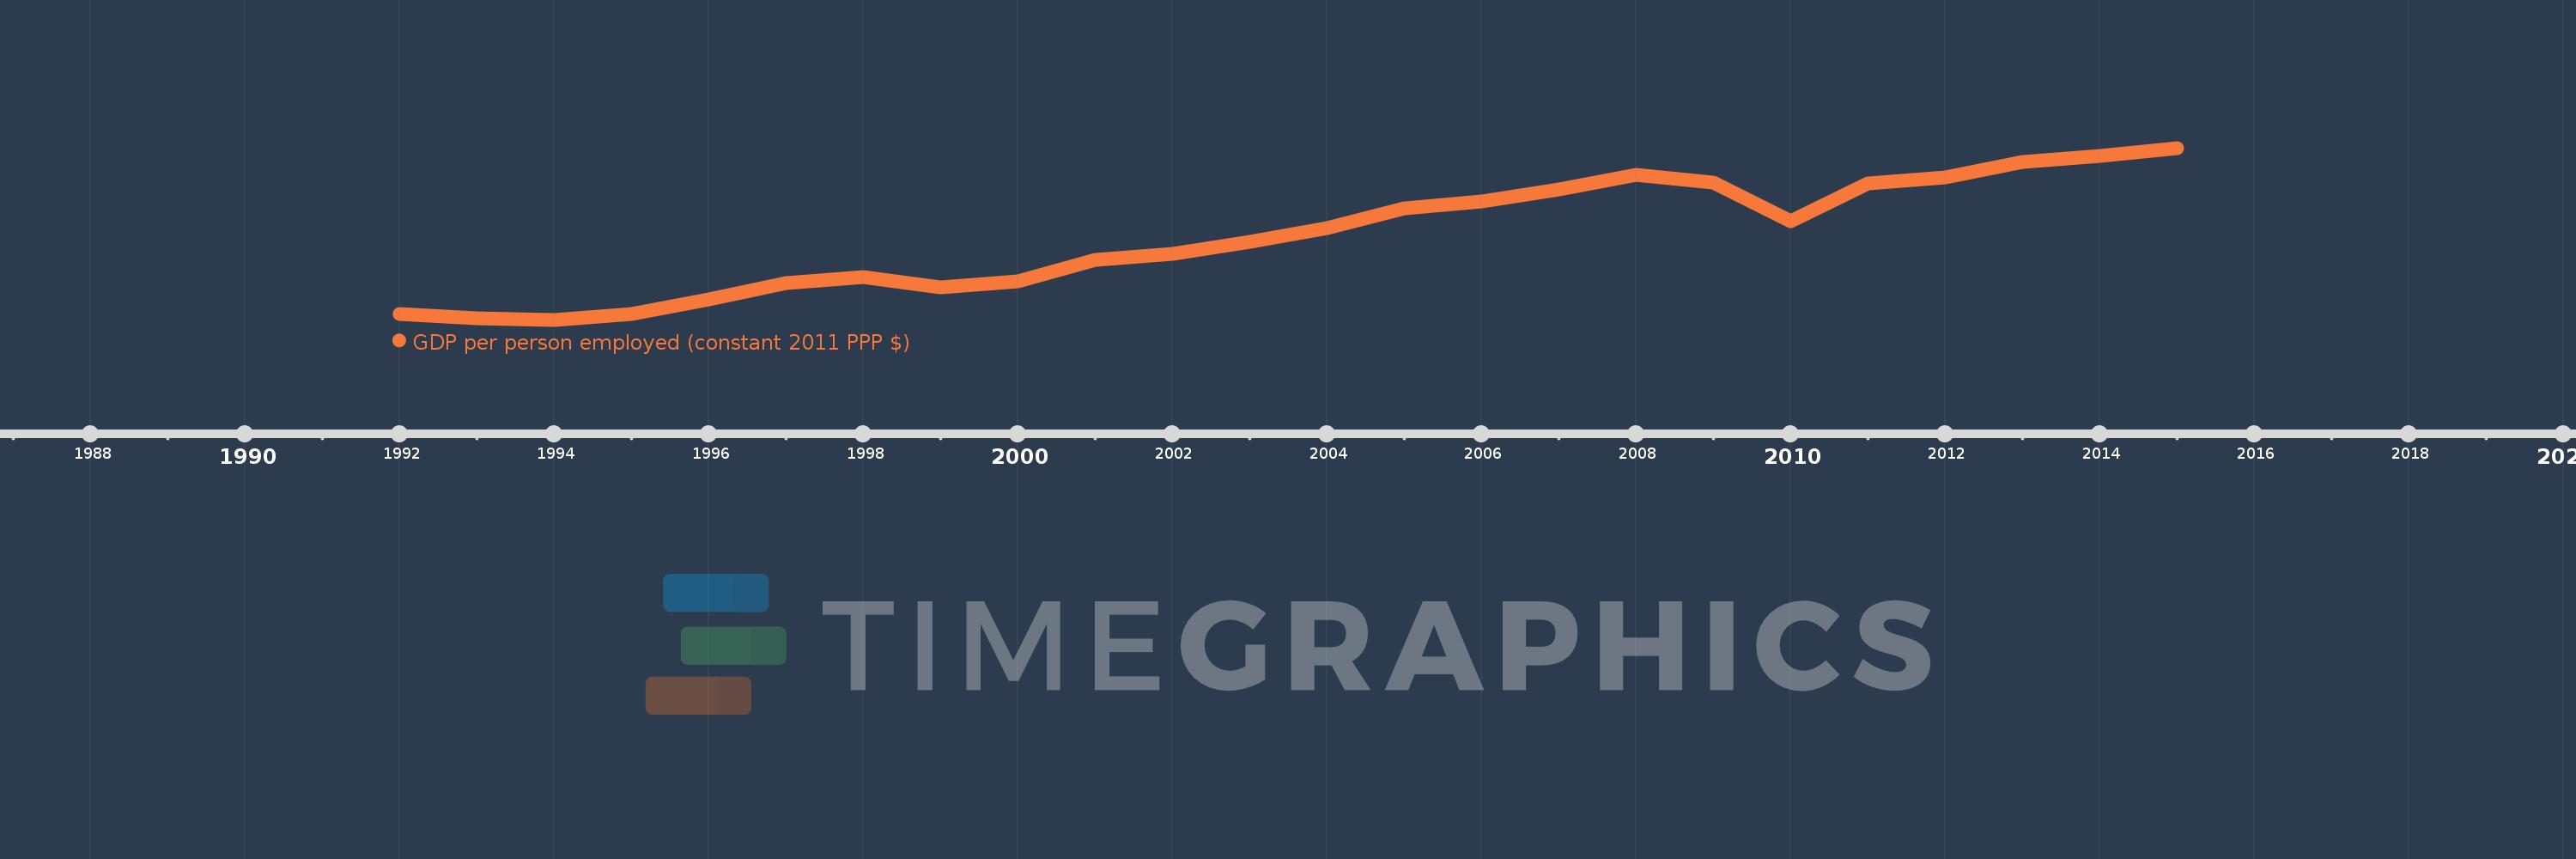
Diese Zeitleiste vorliegt die Graphik ab 1992 J. bis 2015 J. Japan. Die Angaben bis 1991 J. sind nicht vorhanden. Die Zahl aktueller Beobachtungen nach Daten: 24.
Die Quelle (Bezeichnung):
Kennzahlen der Weltentwicklung
Die Quelle (Einrichtung):
International Labour Organization, Key Indicators of the Labour Market database.
Kategorien:
Social Protection & Labor
Es wurde aktualisiert:
23 Apr 2017 Jahr
Kennzahlen der Wertänderungen vom Jahr zum Jahr
im Durchschnitt:
65.759 Tsnd.
Minimum:
59.435 Tsnd.
1 Jan 1994 Jahr
Maximum:
72.523 Tsnd.
1 Jan 2015 Jahr
Zum Datum der Beobachtung
Wert
Absolute Veränderung
Die Veränderung bezüglich dem vorherigen Wert
1 Jan 1992 Jahr
59.854 Tsnd.
+59.854 Tsnd.
0.0%
1 Jan 1993 Jahr
59.547 Tsnd.
-306.371
-0.51%
1 Jan 1994 Jahr
59.435 Tsnd.
-112.199
-0.19%
1 Jan 1995 Jahr
59.883 Tsnd.
+447.871
0.75%
1 Jan 1996 Jahr
60.966 Tsnd.
+1.082 Tsnd.
1.81%
1 Jan 1997 Jahr
62.226 Tsnd.
+1.261 Tsnd.
2.07%
1 Jan 1998 Jahr
62.692 Tsnd.
+465.82
0.75%
1 Jan 1999 Jahr
61.913 Tsnd.
-779.559
-1.24%
1 Jan 2000 Jahr
62.389 Tsnd.
+476.07
0.77%
1 Jan 2001 Jahr
64.017 Tsnd.
+1.628 Tsnd.
2.61%
1 Jan 2002 Jahr
64.463 Tsnd.
+445.848
0.7%
1 Jan 2003 Jahr
65.362 Tsnd.
+899.172
1.39%
1 Jan 2004 Jahr
66.438 Tsnd.
+1.076 Tsnd.
1.65%
1 Jan 2005 Jahr
67.933 Tsnd.
+1.495 Tsnd.
2.25%
1 Jan 2006 Jahr
68.473 Tsnd.
+539.195
0.79%
1 Jan 2007 Jahr
69.362 Tsnd.
+889.57
1.3%
1 Jan 2008 Jahr
70.462 Tsnd.
+1.1 Tsnd.
1.59%
1 Jan 2009 Jahr
69.907 Tsnd.
-555.672
-0.79%
1 Jan 2010 Jahr
66.909 Tsnd.
-2.998 Tsnd.
-4.29%
1 Jan 2011 Jahr
69.834 Tsnd.
+2.925 Tsnd.
4.37%
1 Jan 2012 Jahr
70.293 Tsnd.
+459.258
0.66%
1 Jan 2013 Jahr
71.429 Tsnd.
+1.136 Tsnd.
1.62%
1 Jan 2014 Jahr
71.898 Tsnd.
+468.258
0.66%
1 Jan 2015 Jahr
72.523 Tsnd.
+625.609
0.87%
Bewertung der Länder gemäß mit laufender Statistik nach Jahren

Kommentare:

Abschicken
PremiumAbout & FeedbackVereinbarungPrivatheit
logo
© 2022 Selected Technologies LLC – Morgan Hill, California