29
/de/
de
AIzaSyAYiBZKx7MnpbEhh9jyipgxe19OcubqV5w
April 1, 2024
149140
Haiti
HTI
true
2
1
GDP per person employed (constant 2011 PPP $)
2015,2014,2013,2012,2011,2010,2009,2008,2007,2006,2005,2004,2003,2002,2001,2000,1999,1998,1997,1996,1995,1994,1993,1992
Download
Bibliothek der Globalstatistik →Haiti →

GDP per person employed (constant 2011 PPP $)

Diese Statistik in anderen Ländern:
AfghanistanAlbaniaAlgeriaAngolaArab WorldArgentinaArmeniaAustraliaAustriaAzerbaijanBahamas, TheBahrainBangladeshBarbadosBelarusBelgiumBelizeBeninBhutanBoliviaBosnia and HerzegovinaBotswanaBrazilBrunei DarussalamBulgariaBurkina FasoBurundiCabo VerdeCambodiaCameroonCanadaCaribbean small statesCentral African RepublicCentral Europe and the BalticsChadChileChinaColombiaComorosCongo, Dem. Rep.Congo, Rep.Costa RicaCote d'IvoireCroatiaCubaCyprusCzech RepublicDenmarkDominican RepublicEarly-demographic dividendEast Asia & PacificEast Asia & Pacific (excluding high income)East Asia & Pacific (IDA & IBRD countries)EcuadorEgypt, Arab Rep.El SalvadorEquatorial GuineaEritreaEstoniaEthiopiaEuro areaEurope & Central AsiaEurope & Central Asia (excluding high income)Europe & Central Asia (IDA & IBRD countries)European UnionFijiFinlandFragile and conflict affected situationsFranceGabonGambia, TheGeorgiaGermanyGhanaGreeceGuatemalaGuineaGuinea-BissauGuyanaHaitiHeavily indebted poor countries (HIPC)High incomeHondurasHong Kong SAR, ChinaHungaryIBRD onlyIcelandIDA & IBRD totalIDA blendIDA onlyIDA totalIndiaIndonesiaIran, Islamic Rep.IraqIrelandIsraelItalyJamaicaJapanJordanKazakhstanKenyaKorea, Dem. People’s Rep.Korea, Rep.KuwaitKyrgyz RepublicLao PDRLate-demographic dividendLatin America & Caribbean Latin America & Caribbean (excluding high income)Latin America & the Caribbean (IDA & IBRD countries)LatviaLeast developed countries: UN classificationLebanonLesothoLiberiaLibyaLithuaniaLow & middle incomeLow incomeLower middle incomeLuxembourgMacao SAR, ChinaMacedonia, FYRMadagascarMalawiMalaysiaMaldivesMaliMaltaMauritaniaMauritiusMexicoMiddle East & North AfricaMiddle East & North Africa (excluding high income)Middle East & North Africa (IDA & IBRD countries)Middle incomeMoldovaMongoliaMontenegroMoroccoMozambiqueMyanmarNamibiaNepalNetherlandsNew ZealandNicaraguaNigerNigeriaNorth AmericaNorwayOECD membersOmanOther small statesPakistanPanamaPapua New GuineaParaguayPeruPhilippinesPolandPortugalPost-demographic dividendPre-demographic dividendPuerto RicoQatarRomaniaRussian FederationRwandaSaudi ArabiaSenegalSerbiaSierra LeoneSingaporeSlovak RepublicSloveniaSmall statesSolomon IslandsSomaliaSouth AfricaSouth AsiaSouth Asia (IDA & IBRD)SpainSri LankaSub-Saharan Africa Sub-Saharan Africa (excluding high income)Sub-Saharan Africa (IDA & IBRD countries)SudanSurinameSwazilandSwedenSwitzerlandSyrian Arab RepublicTajikistanTanzaniaThailandTimor-LesteTogoTrinidad and TobagoTunisiaTurkeyTurkmenistanUgandaUkraineUnited Arab EmiratesUnited KingdomUnited StatesUpper middle incomeUruguayUzbekistanVenezuela, RBVietnamWest Bank and GazaWorldYemen, Rep.ZambiaZimbabwe
Zeitlinie:
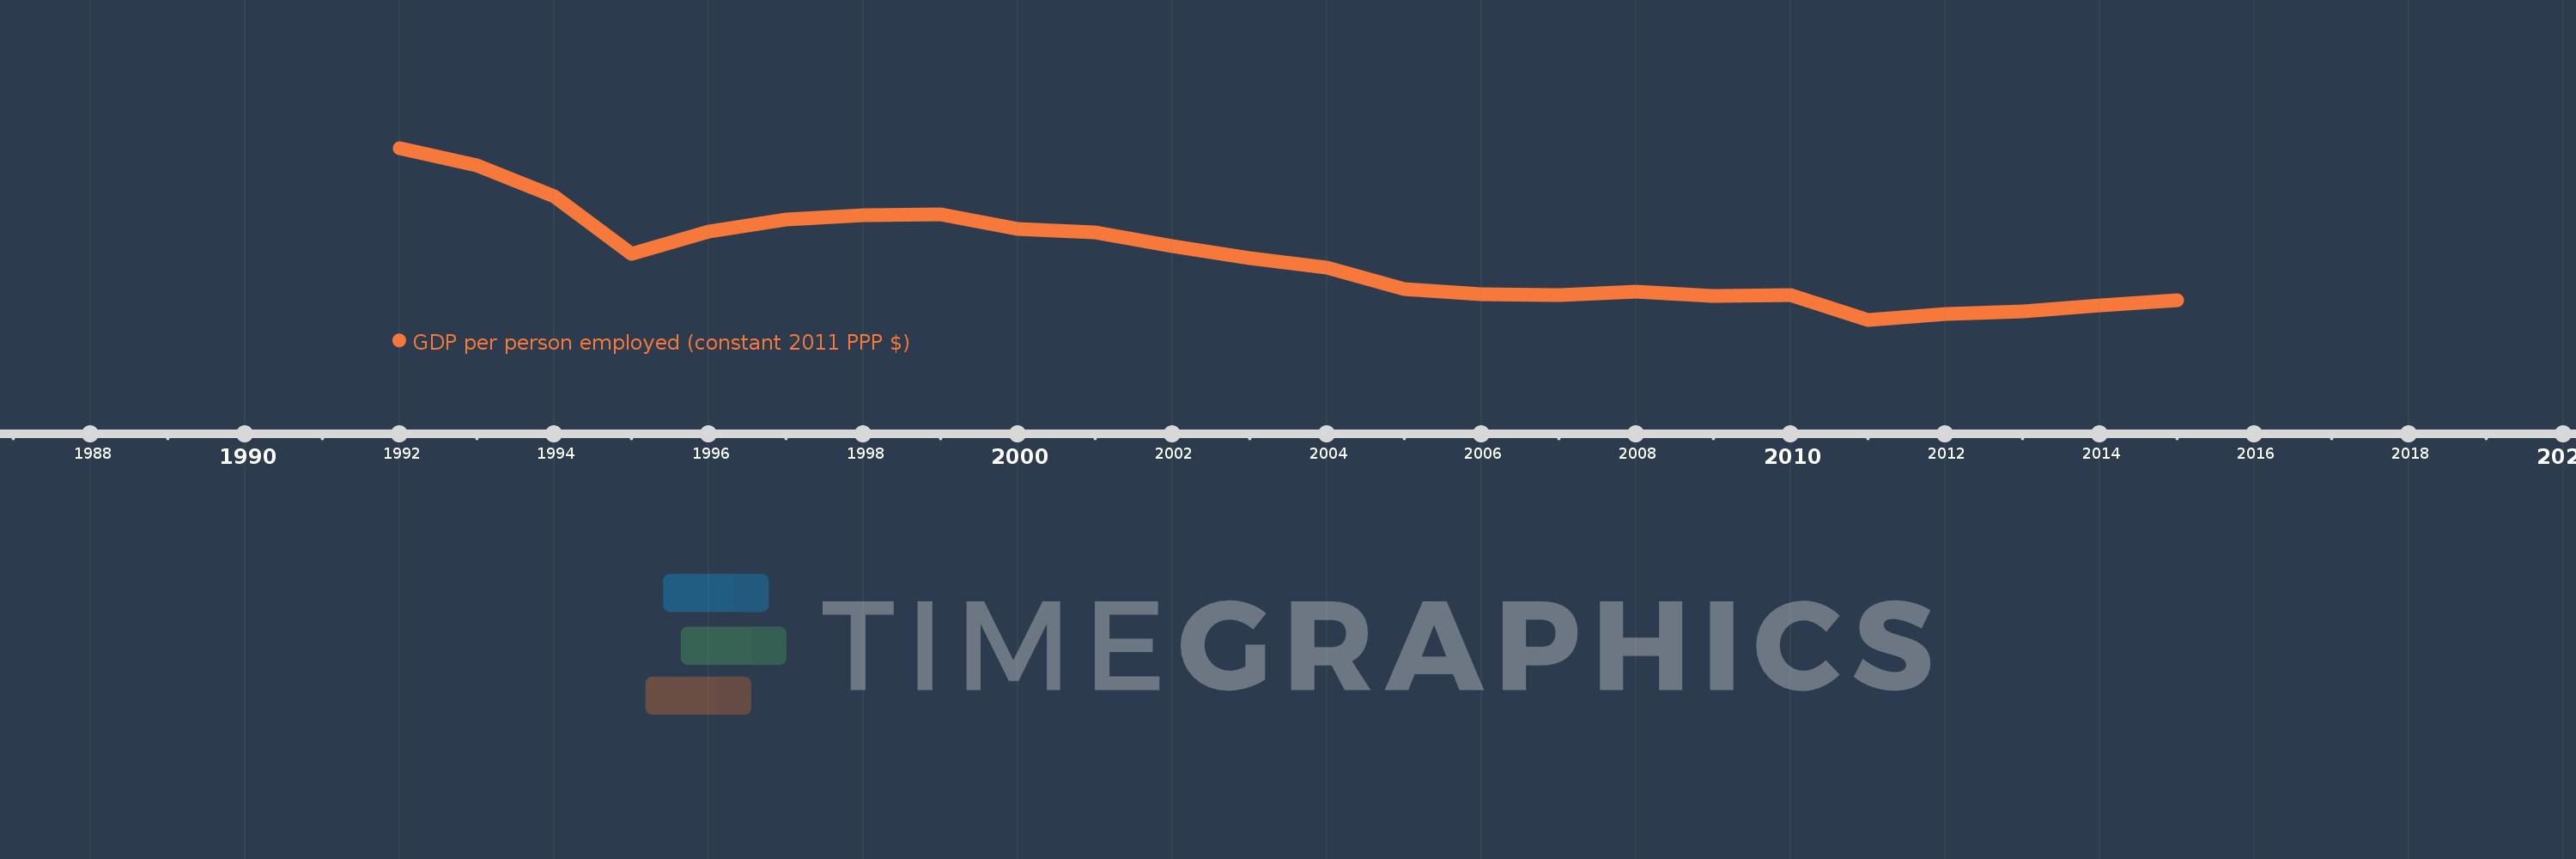
Diese Zeitleiste vorliegt die Graphik ab 1992 J. bis 2015 J. Haiti. Die Angaben bis 1991 J. sind nicht vorhanden. Die Zahl aktueller Beobachtungen nach Daten: 24.
Die Quelle (Bezeichnung):
Kennzahlen der Weltentwicklung
Die Quelle (Einrichtung):
International Labour Organization, Key Indicators of the Labour Market database.
Kategorien:
Social Protection & Labor
Es wurde aktualisiert:
23 Apr 2017 Jahr
Kennzahlen der Wertänderungen vom Jahr zum Jahr
im Durchschnitt:
4.695 Tsnd.
Minimum:
3.967 Tsnd.
1 Jan 2011 Jahr
Maximum:
5.987 Tsnd.
1 Jan 1992 Jahr
Zum Datum der Beobachtung
Wert
Absolute Veränderung
Die Veränderung bezüglich dem vorherigen Wert
1 Jan 1992 Jahr
5.987 Tsnd.
+5.987 Tsnd.
0.0%
1 Jan 1993 Jahr
5.778 Tsnd.
-208.47
-3.48%
1 Jan 1994 Jahr
5.417 Tsnd.
-361.44
-6.26%
1 Jan 1995 Jahr
4.745 Tsnd.
-672.22
-12.41%
1 Jan 1996 Jahr
5.004 Tsnd.
+259.15
5.46%
1 Jan 1997 Jahr
5.144 Tsnd.
+140.67
2.81%
1 Jan 1998 Jahr
5.192 Tsnd.
+47.39
0.92%
1 Jan 1999 Jahr
5.209 Tsnd.
+17.03
0.33%
1 Jan 2000 Jahr
5.038 Tsnd.
-170.33
-3.27%
1 Jan 2001 Jahr
4.997 Tsnd.
-41.29
-0.82%
1 Jan 2002 Jahr
4.831 Tsnd.
-165.75
-3.32%
1 Jan 2003 Jahr
4.691 Tsnd.
-140.46
-2.91%
1 Jan 2004 Jahr
4.585 Tsnd.
-106.08
-2.26%
1 Jan 2005 Jahr
4.332 Tsnd.
-252.67
-5.51%
1 Jan 2006 Jahr
4.271 Tsnd.
-61.66
-1.42%
1 Jan 2007 Jahr
4.261 Tsnd.
-9.43
-0.22%
1 Jan 2008 Jahr
4.296 Tsnd.
+34.82
0.82%
1 Jan 2009 Jahr
4.243 Tsnd.
-53.16
-1.24%
1 Jan 2010 Jahr
4.261 Tsnd.
+18.25
0.43%
1 Jan 2011 Jahr
3.967 Tsnd.
-293.82
-6.9%
1 Jan 2012 Jahr
4.035 Tsnd.
+67.8
1.71%
1 Jan 2013 Jahr
4.066 Tsnd.
+31.52
0.78%
1 Jan 2014 Jahr
4.135 Tsnd.
+68.51
1.68%
1 Jan 2015 Jahr
4.192 Tsnd.
+57.21
1.38%
Bewertung der Länder gemäß mit laufender Statistik nach Jahren

Kommentare:

Abschicken
PremiumAbout & FeedbackVereinbarungPrivatheit
logo
© 2022 Selected Technologies LLC – Morgan Hill, California