29
/de/
de
AIzaSyAYiBZKx7MnpbEhh9jyipgxe19OcubqV5w
April 1, 2024
158452
Iraq
IRQ
true
2
1
GDP per person employed (constant 2011 PPP $)
2015,2014,2013,2012,2011,2010,2009,2008,2007,2006,2005,2004,2003,2002,2001,2000,1999,1998,1997,1996,1995,1994,1993,1992
Download
Bibliothek der Globalstatistik →Iraq →

GDP per person employed (constant 2011 PPP $)

Diese Statistik in anderen Ländern:
AfghanistanAlbaniaAlgeriaAngolaArab WorldArgentinaArmeniaAustraliaAustriaAzerbaijanBahamas, TheBahrainBangladeshBarbadosBelarusBelgiumBelizeBeninBhutanBoliviaBosnia and HerzegovinaBotswanaBrazilBrunei DarussalamBulgariaBurkina FasoBurundiCabo VerdeCambodiaCameroonCanadaCaribbean small statesCentral African RepublicCentral Europe and the BalticsChadChileChinaColombiaComorosCongo, Dem. Rep.Congo, Rep.Costa RicaCote d'IvoireCroatiaCubaCyprusCzech RepublicDenmarkDominican RepublicEarly-demographic dividendEast Asia & PacificEast Asia & Pacific (excluding high income)East Asia & Pacific (IDA & IBRD countries)EcuadorEgypt, Arab Rep.El SalvadorEquatorial GuineaEritreaEstoniaEthiopiaEuro areaEurope & Central AsiaEurope & Central Asia (excluding high income)Europe & Central Asia (IDA & IBRD countries)European UnionFijiFinlandFragile and conflict affected situationsFranceGabonGambia, TheGeorgiaGermanyGhanaGreeceGuatemalaGuineaGuinea-BissauGuyanaHaitiHeavily indebted poor countries (HIPC)High incomeHondurasHong Kong SAR, ChinaHungaryIBRD onlyIcelandIDA & IBRD totalIDA blendIDA onlyIDA totalIndiaIndonesiaIran, Islamic Rep.IraqIrelandIsraelItalyJamaicaJapanJordanKazakhstanKenyaKorea, Dem. People’s Rep.Korea, Rep.KuwaitKyrgyz RepublicLao PDRLate-demographic dividendLatin America & Caribbean Latin America & Caribbean (excluding high income)Latin America & the Caribbean (IDA & IBRD countries)LatviaLeast developed countries: UN classificationLebanonLesothoLiberiaLibyaLithuaniaLow & middle incomeLow incomeLower middle incomeLuxembourgMacao SAR, ChinaMacedonia, FYRMadagascarMalawiMalaysiaMaldivesMaliMaltaMauritaniaMauritiusMexicoMiddle East & North AfricaMiddle East & North Africa (excluding high income)Middle East & North Africa (IDA & IBRD countries)Middle incomeMoldovaMongoliaMontenegroMoroccoMozambiqueMyanmarNamibiaNepalNetherlandsNew ZealandNicaraguaNigerNigeriaNorth AmericaNorwayOECD membersOmanOther small statesPakistanPanamaPapua New GuineaParaguayPeruPhilippinesPolandPortugalPost-demographic dividendPre-demographic dividendPuerto RicoQatarRomaniaRussian FederationRwandaSaudi ArabiaSenegalSerbiaSierra LeoneSingaporeSlovak RepublicSloveniaSmall statesSolomon IslandsSomaliaSouth AfricaSouth AsiaSouth Asia (IDA & IBRD)SpainSri LankaSub-Saharan Africa Sub-Saharan Africa (excluding high income)Sub-Saharan Africa (IDA & IBRD countries)SudanSurinameSwazilandSwedenSwitzerlandSyrian Arab RepublicTajikistanTanzaniaThailandTimor-LesteTogoTrinidad and TobagoTunisiaTurkeyTurkmenistanUgandaUkraineUnited Arab EmiratesUnited KingdomUnited StatesUpper middle incomeUruguayUzbekistanVenezuela, RBVietnamWest Bank and GazaWorldYemen, Rep.ZambiaZimbabwe
Zeitlinie:
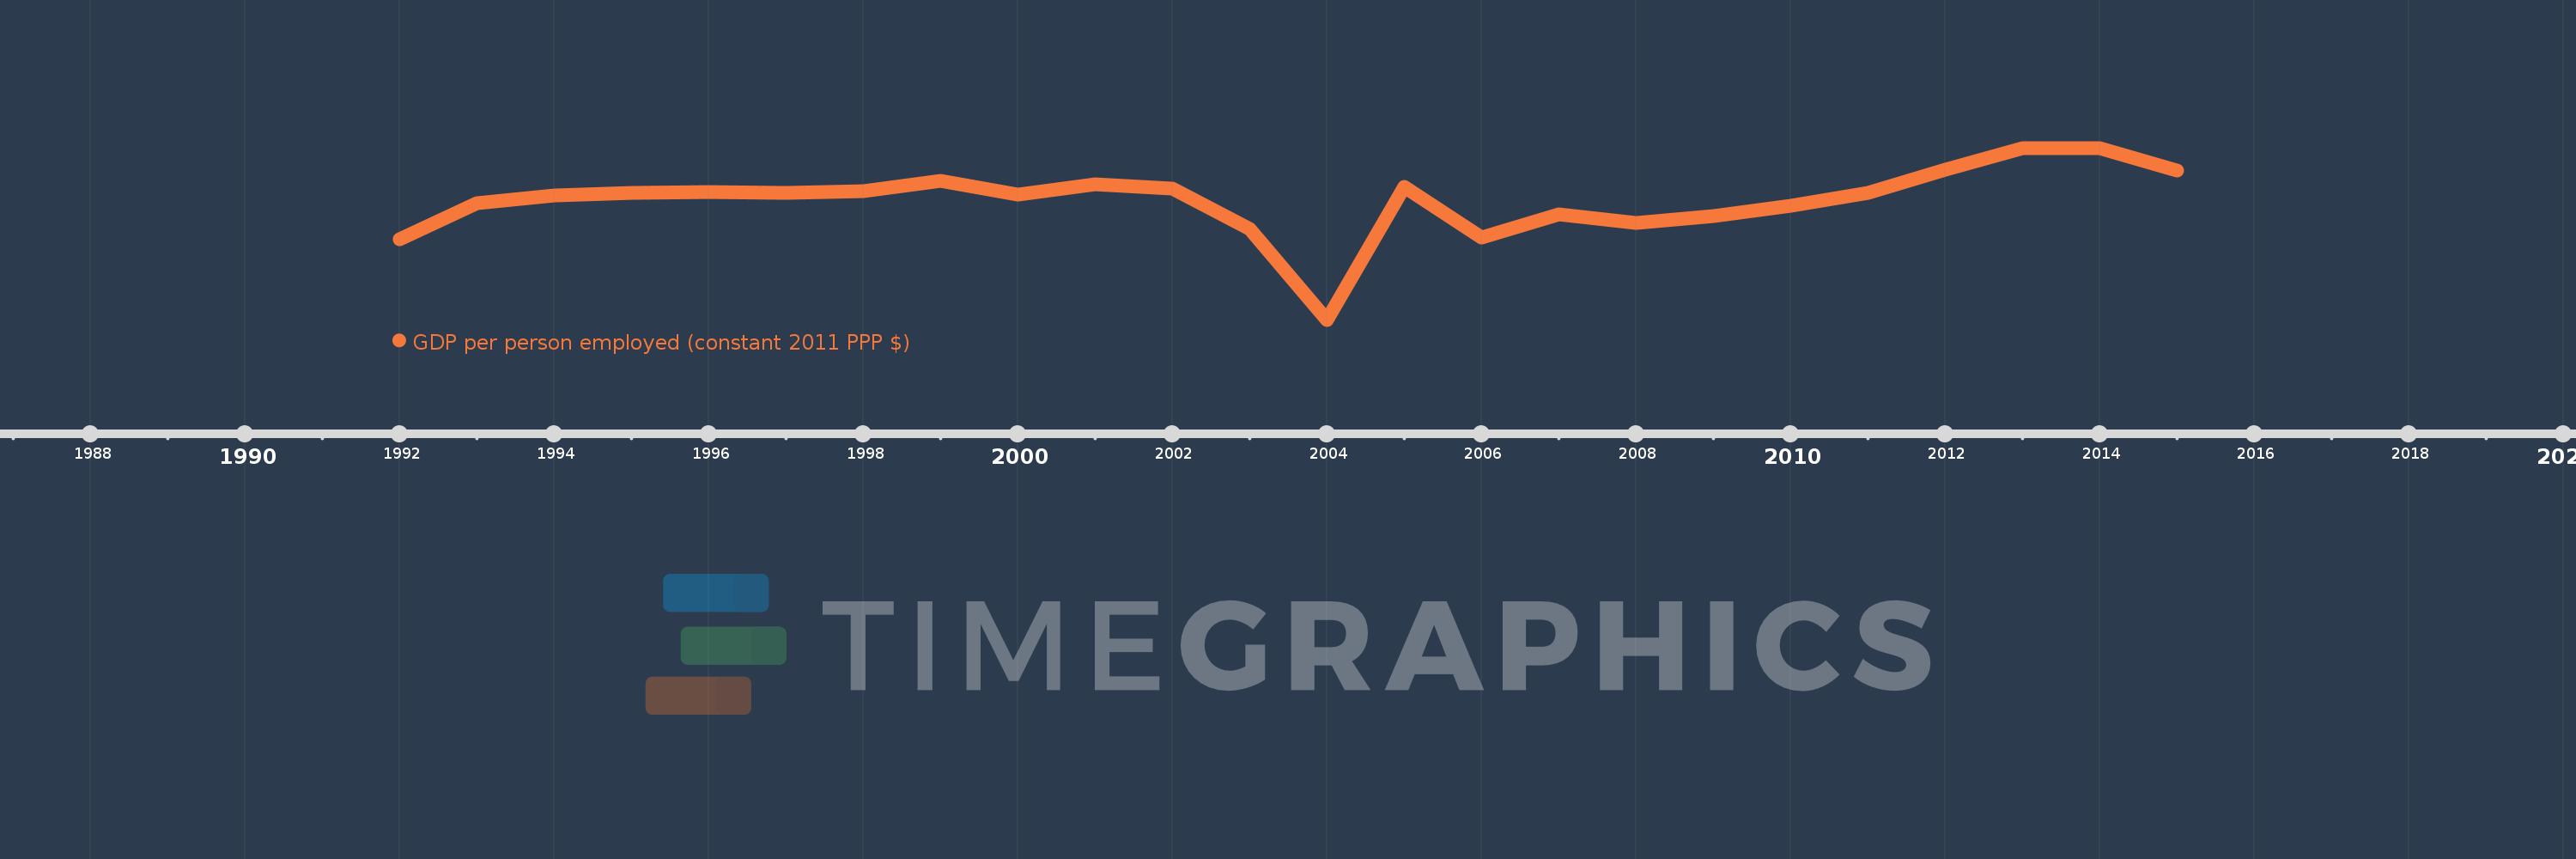
Diese Zeitleiste vorliegt die Graphik ab 1992 J. bis 2015 J. Iraq. Die Angaben bis 1991 J. sind nicht vorhanden. Die Zahl aktueller Beobachtungen nach Daten: 24.
Die Quelle (Bezeichnung):
Kennzahlen der Weltentwicklung
Die Quelle (Einrichtung):
International Labour Organization, Key Indicators of the Labour Market database.
Kategorien:
Social Protection & Labor
Es wurde aktualisiert:
23 Apr 2017 Jahr
Kennzahlen der Wertänderungen vom Jahr zum Jahr
im Durchschnitt:
59.818 Tsnd.
Minimum:
42.033 Tsnd.
1 Jan 2004 Jahr
Maximum:
67.692 Tsnd.
1 Jan 2013 Jahr
Zum Datum der Beobachtung
Wert
Absolute Veränderung
Die Veränderung bezüglich dem vorherigen Wert
1 Jan 1992 Jahr
54.059 Tsnd.
+54.059 Tsnd.
0.0%
1 Jan 1993 Jahr
59.461 Tsnd.
+5.402 Tsnd.
9.99%
1 Jan 1994 Jahr
60.606 Tsnd.
+1.145 Tsnd.
1.93%
1 Jan 1995 Jahr
60.957 Tsnd.
+350.719
0.58%
1 Jan 1996 Jahr
61.145 Tsnd.
+188.449
0.31%
1 Jan 1997 Jahr
61.015 Tsnd.
-130.539
-0.21%
1 Jan 1998 Jahr
61.289 Tsnd.
+273.832
0.45%
1 Jan 1999 Jahr
62.774 Tsnd.
+1.486 Tsnd.
2.42%
1 Jan 2000 Jahr
60.776 Tsnd.
-1.998 Tsnd.
-3.18%
1 Jan 2001 Jahr
62.246 Tsnd.
+1.47 Tsnd.
2.42%
1 Jan 2002 Jahr
61.628 Tsnd.
-617.969
-0.99%
1 Jan 2003 Jahr
55.652 Tsnd.
-5.976 Tsnd.
-9.7%
1 Jan 2004 Jahr
42.033 Tsnd.
-13.619 Tsnd.
-24.47%
1 Jan 2005 Jahr
61.884 Tsnd.
+19.851 Tsnd.
47.23%
1 Jan 2006 Jahr
54.334 Tsnd.
-7.55 Tsnd.
-12.2%
1 Jan 2007 Jahr
57.777 Tsnd.
+3.442 Tsnd.
6.34%
1 Jan 2008 Jahr
56.481 Tsnd.
-1.296 Tsnd.
-2.24%
1 Jan 2009 Jahr
57.506 Tsnd.
+1.025 Tsnd.
1.81%
1 Jan 2010 Jahr
58.999 Tsnd.
+1.494 Tsnd.
2.6%
1 Jan 2011 Jahr
60.938 Tsnd.
+1.938 Tsnd.
3.29%
1 Jan 2012 Jahr
64.46 Tsnd.
+3.523 Tsnd.
5.78%
1 Jan 2013 Jahr
67.692 Tsnd.
+3.232 Tsnd.
5.01%
1 Jan 2014 Jahr
67.599 Tsnd.
-93.109
-0.14%
1 Jan 2015 Jahr
64.321 Tsnd.
-3.279 Tsnd.
-4.85%
Bewertung der Länder gemäß mit laufender Statistik nach Jahren

Kommentare:

Abschicken
PremiumAbout & FeedbackVereinbarungPrivatheit
logo
© 2022 Selected Technologies LLC – Morgan Hill, California