29
/de/
de
AIzaSyAYiBZKx7MnpbEhh9jyipgxe19OcubqV5w
April 1, 2024
64715
Albania
ALB
true
2
1
GDP per person employed (constant 2011 PPP $)
2015,2014,2013,2012,2011,2010,2009,2008,2007,2006,2005,2004,2003,2002,2001,2000,1999,1998,1997,1996,1995,1994,1993,1992
Download
Bibliothek der Globalstatistik →Albania →

GDP per person employed (constant 2011 PPP $)

Diese Statistik in anderen Ländern:
AfghanistanAlbaniaAlgeriaAngolaArab WorldArgentinaArmeniaAustraliaAustriaAzerbaijanBahamas, TheBahrainBangladeshBarbadosBelarusBelgiumBelizeBeninBhutanBoliviaBosnia and HerzegovinaBotswanaBrazilBrunei DarussalamBulgariaBurkina FasoBurundiCabo VerdeCambodiaCameroonCanadaCaribbean small statesCentral African RepublicCentral Europe and the BalticsChadChileChinaColombiaComorosCongo, Dem. Rep.Congo, Rep.Costa RicaCote d'IvoireCroatiaCubaCyprusCzech RepublicDenmarkDominican RepublicEarly-demographic dividendEast Asia & PacificEast Asia & Pacific (excluding high income)East Asia & Pacific (IDA & IBRD countries)EcuadorEgypt, Arab Rep.El SalvadorEquatorial GuineaEritreaEstoniaEthiopiaEuro areaEurope & Central AsiaEurope & Central Asia (excluding high income)Europe & Central Asia (IDA & IBRD countries)European UnionFijiFinlandFragile and conflict affected situationsFranceGabonGambia, TheGeorgiaGermanyGhanaGreeceGuatemalaGuineaGuinea-BissauGuyanaHaitiHeavily indebted poor countries (HIPC)High incomeHondurasHong Kong SAR, ChinaHungaryIBRD onlyIcelandIDA & IBRD totalIDA blendIDA onlyIDA totalIndiaIndonesiaIran, Islamic Rep.IraqIrelandIsraelItalyJamaicaJapanJordanKazakhstanKenyaKorea, Dem. People’s Rep.Korea, Rep.KuwaitKyrgyz RepublicLao PDRLate-demographic dividendLatin America & Caribbean Latin America & Caribbean (excluding high income)Latin America & the Caribbean (IDA & IBRD countries)LatviaLeast developed countries: UN classificationLebanonLesothoLiberiaLibyaLithuaniaLow & middle incomeLow incomeLower middle incomeLuxembourgMacao SAR, ChinaMacedonia, FYRMadagascarMalawiMalaysiaMaldivesMaliMaltaMauritaniaMauritiusMexicoMiddle East & North AfricaMiddle East & North Africa (excluding high income)Middle East & North Africa (IDA & IBRD countries)Middle incomeMoldovaMongoliaMontenegroMoroccoMozambiqueMyanmarNamibiaNepalNetherlandsNew ZealandNicaraguaNigerNigeriaNorth AmericaNorwayOECD membersOmanOther small statesPakistanPanamaPapua New GuineaParaguayPeruPhilippinesPolandPortugalPost-demographic dividendPre-demographic dividendPuerto RicoQatarRomaniaRussian FederationRwandaSaudi ArabiaSenegalSerbiaSierra LeoneSingaporeSlovak RepublicSloveniaSmall statesSolomon IslandsSomaliaSouth AfricaSouth AsiaSouth Asia (IDA & IBRD)SpainSri LankaSub-Saharan Africa Sub-Saharan Africa (excluding high income)Sub-Saharan Africa (IDA & IBRD countries)SudanSurinameSwazilandSwedenSwitzerlandSyrian Arab RepublicTajikistanTanzaniaThailandTimor-LesteTogoTrinidad and TobagoTunisiaTurkeyTurkmenistanUgandaUkraineUnited Arab EmiratesUnited KingdomUnited StatesUpper middle incomeUruguayUzbekistanVenezuela, RBVietnamWest Bank and GazaWorldYemen, Rep.ZambiaZimbabwe
Zeitlinie:
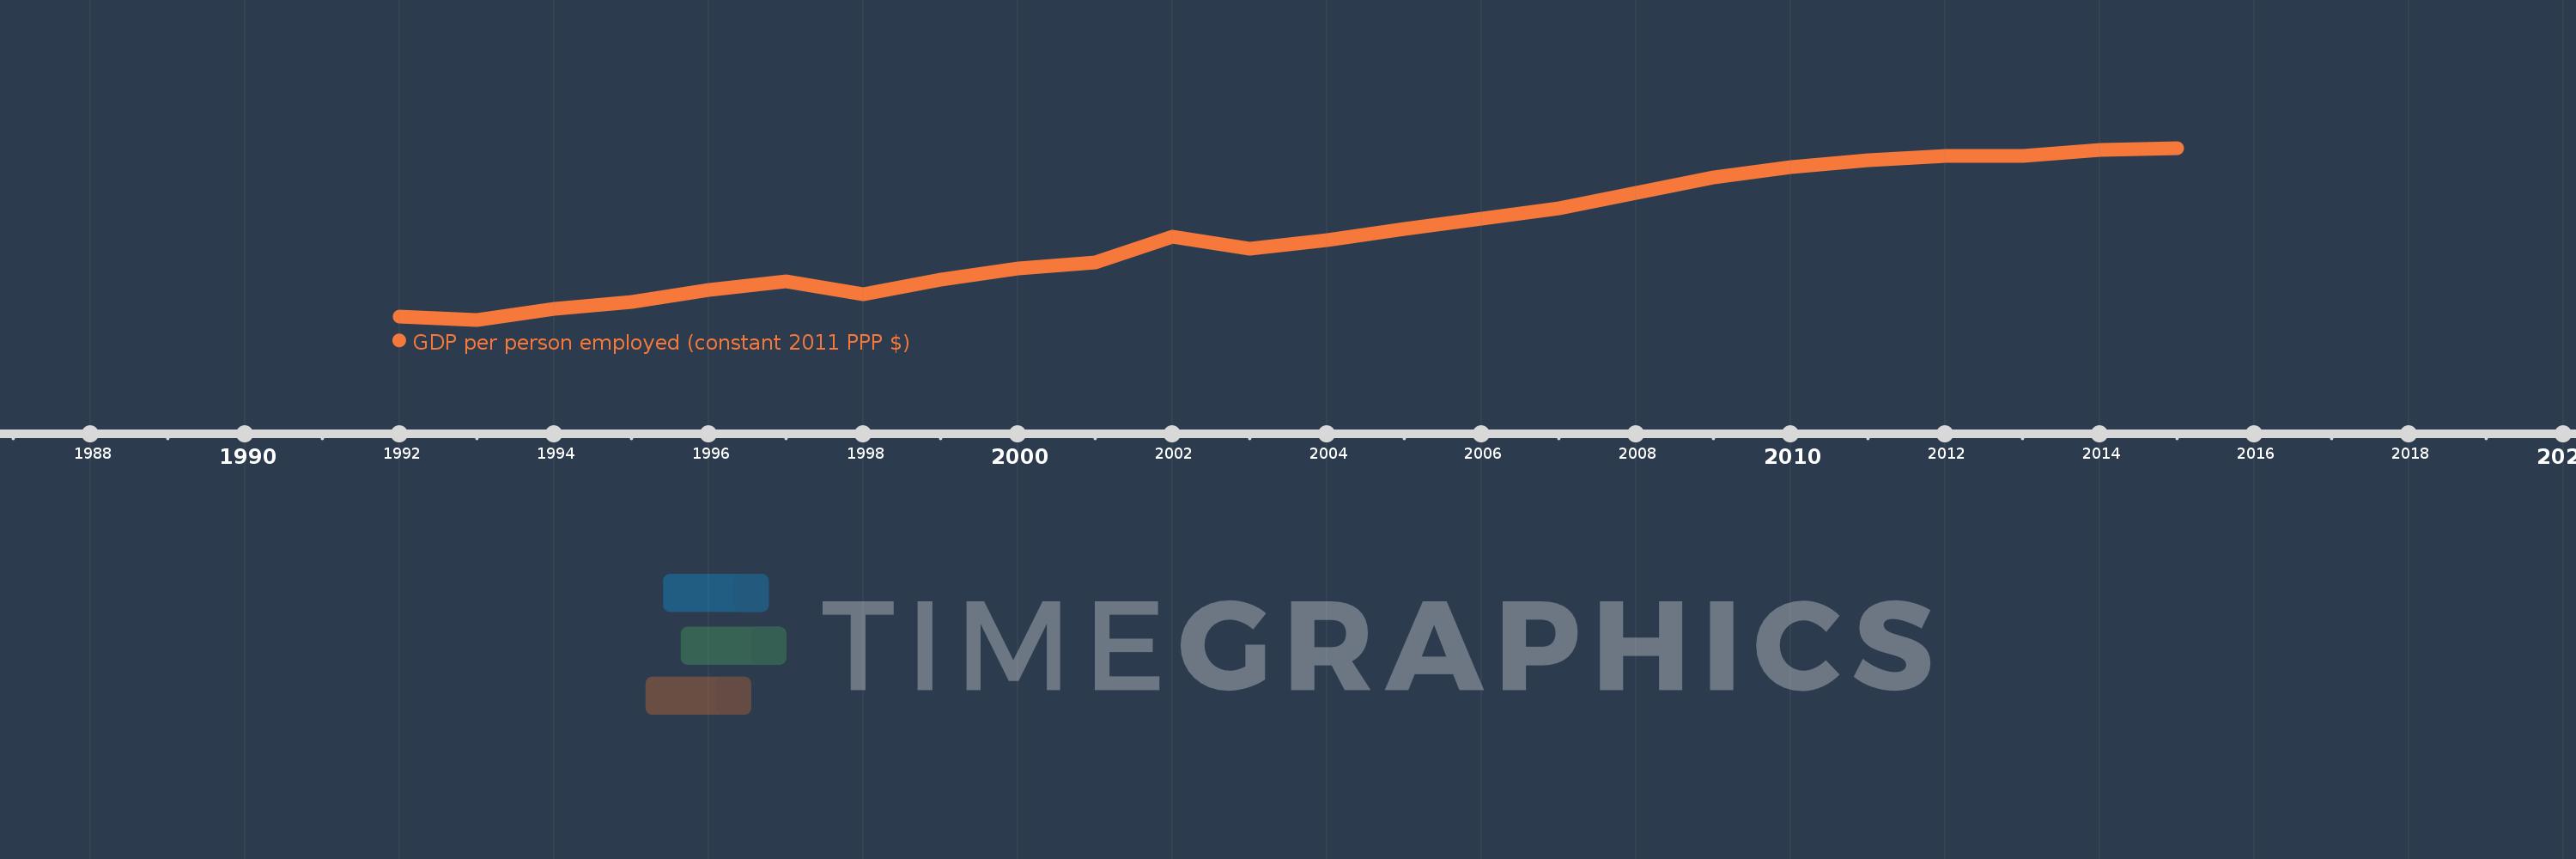
Diese Zeitleiste vorliegt die Graphik ab 1992 J. bis 2015 J. Albania. Die Angaben bis 1991 J. sind nicht vorhanden. Die Zahl aktueller Beobachtungen nach Daten: 24.
Die Quelle (Bezeichnung):
Kennzahlen der Weltentwicklung
Die Quelle (Einrichtung):
International Labour Organization, Key Indicators of the Labour Market database.
Kategorien:
Social Protection & Labor
Es wurde aktualisiert:
23 Apr 2017 Jahr
Kennzahlen der Wertänderungen vom Jahr zum Jahr
im Durchschnitt:
16.448 Tsnd.
Minimum:
7.474 Tsnd.
1 Jan 1993 Jahr
Maximum:
25.434 Tsnd.
1 Jan 2015 Jahr
Zum Datum der Beobachtung
Wert
Absolute Veränderung
Die Veränderung bezüglich dem vorherigen Wert
1 Jan 1992 Jahr
7.803 Tsnd.
+7.803 Tsnd.
0.0%
1 Jan 1993 Jahr
7.474 Tsnd.
-328.59
-4.21%
1 Jan 1994 Jahr
8.576 Tsnd.
+1.102 Tsnd.
14.74%
1 Jan 1995 Jahr
9.341 Tsnd.
+765.56
8.93%
1 Jan 1996 Jahr
10.584 Tsnd.
+1.242 Tsnd.
13.3%
1 Jan 1997 Jahr
11.461 Tsnd.
+877.79
8.29%
1 Jan 1998 Jahr
10.11 Tsnd.
-1.352 Tsnd.
-11.79%
1 Jan 1999 Jahr
11.647 Tsnd.
+1.538 Tsnd.
15.21%
1 Jan 2000 Jahr
12.877 Tsnd.
+1.229 Tsnd.
10.56%
1 Jan 2001 Jahr
13.46 Tsnd.
+583.44
4.53%
1 Jan 2002 Jahr
16.191 Tsnd.
+2.731 Tsnd.
20.29%
1 Jan 2003 Jahr
14.88 Tsnd.
-1.311 Tsnd.
-8.1%
1 Jan 2004 Jahr
15.805 Tsnd.
+924.949
6.22%
1 Jan 2005 Jahr
16.931 Tsnd.
+1.125 Tsnd.
7.12%
1 Jan 2006 Jahr
18.04 Tsnd.
+1.109 Tsnd.
6.55%
1 Jan 2007 Jahr
19.133 Tsnd.
+1.093 Tsnd.
6.06%
1 Jan 2008 Jahr
20.714 Tsnd.
+1.581 Tsnd.
8.26%
1 Jan 2009 Jahr
22.347 Tsnd.
+1.633 Tsnd.
7.89%
1 Jan 2010 Jahr
23.447 Tsnd.
+1.1 Tsnd.
4.92%
1 Jan 2011 Jahr
24.142 Tsnd.
+694.148
2.96%
1 Jan 2012 Jahr
24.567 Tsnd.
+425.432
1.76%
1 Jan 2013 Jahr
24.57 Tsnd.
+3.02
0.01%
1 Jan 2014 Jahr
25.21 Tsnd.
+639.891
2.6%
1 Jan 2015 Jahr
25.434 Tsnd.
+223.77
0.89%
Bewertung der Länder gemäß mit laufender Statistik nach Jahren

Kommentare:

Abschicken
PremiumAbout & FeedbackVereinbarungPrivatheit
logo
© 2022 Selected Technologies LLC – Morgan Hill, California