29
/de/
de
AIzaSyAYiBZKx7MnpbEhh9jyipgxe19OcubqV5w
April 1, 2024
72977
Australia
AUS
true
2
1
GDP per person employed (constant 2011 PPP $)
2015,2014,2013,2012,2011,2010,2009,2008,2007,2006,2005,2004,2003,2002,2001,2000,1999,1998,1997,1996,1995,1994,1993,1992
Download
Bibliothek der Globalstatistik →Australia →

GDP per person employed (constant 2011 PPP $)

Diese Statistik in anderen Ländern:
AfghanistanAlbaniaAlgeriaAngolaArab WorldArgentinaArmeniaAustraliaAustriaAzerbaijanBahamas, TheBahrainBangladeshBarbadosBelarusBelgiumBelizeBeninBhutanBoliviaBosnia and HerzegovinaBotswanaBrazilBrunei DarussalamBulgariaBurkina FasoBurundiCabo VerdeCambodiaCameroonCanadaCaribbean small statesCentral African RepublicCentral Europe and the BalticsChadChileChinaColombiaComorosCongo, Dem. Rep.Congo, Rep.Costa RicaCote d'IvoireCroatiaCubaCyprusCzech RepublicDenmarkDominican RepublicEarly-demographic dividendEast Asia & PacificEast Asia & Pacific (excluding high income)East Asia & Pacific (IDA & IBRD countries)EcuadorEgypt, Arab Rep.El SalvadorEquatorial GuineaEritreaEstoniaEthiopiaEuro areaEurope & Central AsiaEurope & Central Asia (excluding high income)Europe & Central Asia (IDA & IBRD countries)European UnionFijiFinlandFragile and conflict affected situationsFranceGabonGambia, TheGeorgiaGermanyGhanaGreeceGuatemalaGuineaGuinea-BissauGuyanaHaitiHeavily indebted poor countries (HIPC)High incomeHondurasHong Kong SAR, ChinaHungaryIBRD onlyIcelandIDA & IBRD totalIDA blendIDA onlyIDA totalIndiaIndonesiaIran, Islamic Rep.IraqIrelandIsraelItalyJamaicaJapanJordanKazakhstanKenyaKorea, Dem. People’s Rep.Korea, Rep.KuwaitKyrgyz RepublicLao PDRLate-demographic dividendLatin America & Caribbean Latin America & Caribbean (excluding high income)Latin America & the Caribbean (IDA & IBRD countries)LatviaLeast developed countries: UN classificationLebanonLesothoLiberiaLibyaLithuaniaLow & middle incomeLow incomeLower middle incomeLuxembourgMacao SAR, ChinaMacedonia, FYRMadagascarMalawiMalaysiaMaldivesMaliMaltaMauritaniaMauritiusMexicoMiddle East & North AfricaMiddle East & North Africa (excluding high income)Middle East & North Africa (IDA & IBRD countries)Middle incomeMoldovaMongoliaMontenegroMoroccoMozambiqueMyanmarNamibiaNepalNetherlandsNew ZealandNicaraguaNigerNigeriaNorth AmericaNorwayOECD membersOmanOther small statesPakistanPanamaPapua New GuineaParaguayPeruPhilippinesPolandPortugalPost-demographic dividendPre-demographic dividendPuerto RicoQatarRomaniaRussian FederationRwandaSaudi ArabiaSenegalSerbiaSierra LeoneSingaporeSlovak RepublicSloveniaSmall statesSolomon IslandsSomaliaSouth AfricaSouth AsiaSouth Asia (IDA & IBRD)SpainSri LankaSub-Saharan Africa Sub-Saharan Africa (excluding high income)Sub-Saharan Africa (IDA & IBRD countries)SudanSurinameSwazilandSwedenSwitzerlandSyrian Arab RepublicTajikistanTanzaniaThailandTimor-LesteTogoTrinidad and TobagoTunisiaTurkeyTurkmenistanUgandaUkraineUnited Arab EmiratesUnited KingdomUnited StatesUpper middle incomeUruguayUzbekistanVenezuela, RBVietnamWest Bank and GazaWorldYemen, Rep.ZambiaZimbabwe
Zeitlinie:
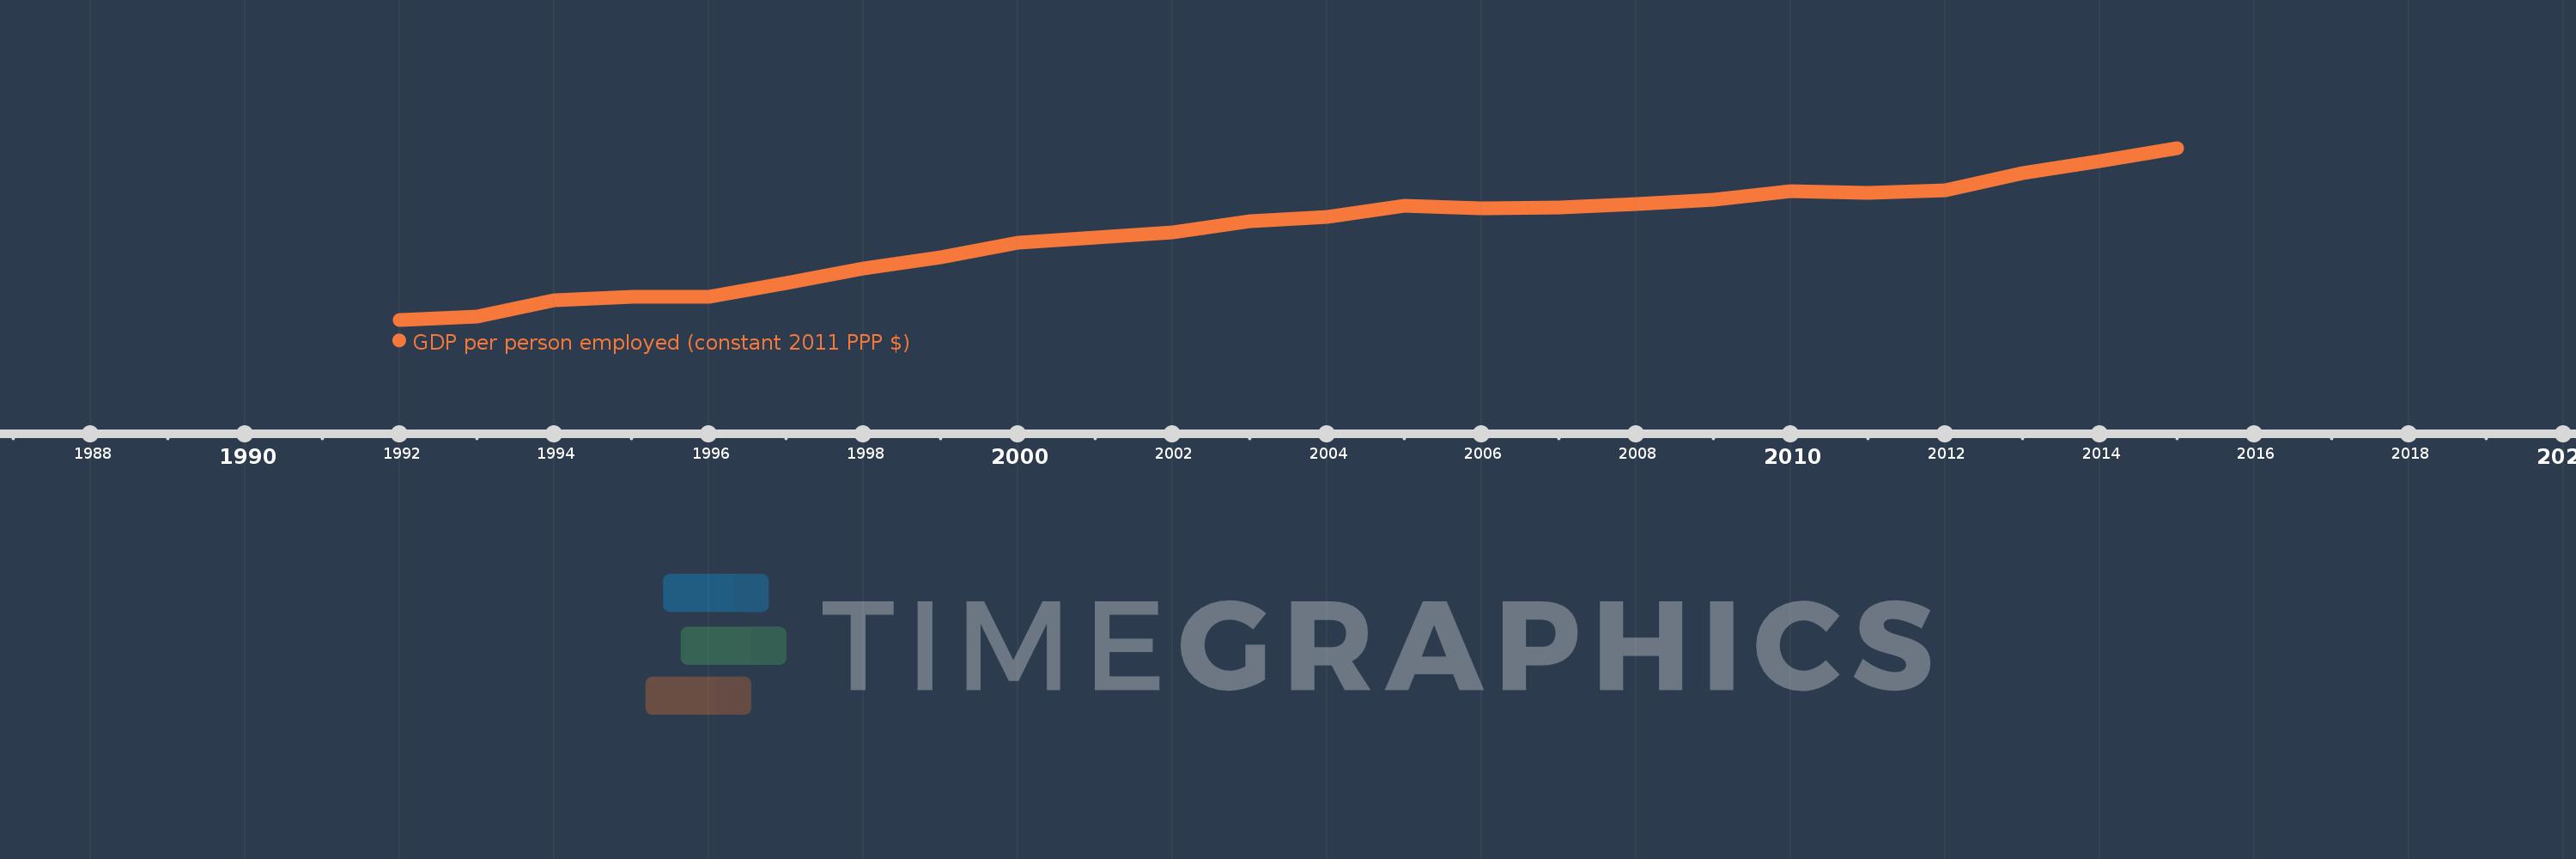
Diese Zeitleiste vorliegt die Graphik ab 1992 J. bis 2015 J. Australia. Die Angaben bis 1991 J. sind nicht vorhanden. Die Zahl aktueller Beobachtungen nach Daten: 24.
Die Quelle (Bezeichnung):
Kennzahlen der Weltentwicklung
Die Quelle (Einrichtung):
International Labour Organization, Key Indicators of the Labour Market database.
Kategorien:
Social Protection & Labor
Es wurde aktualisiert:
23 Apr 2017 Jahr
Kennzahlen der Wertänderungen vom Jahr zum Jahr
im Durchschnitt:
75.139 Tsnd.
Minimum:
62.821 Tsnd.
1 Jan 1992 Jahr
Maximum:
86.972 Tsnd.
1 Jan 2015 Jahr
Zum Datum der Beobachtung
Wert
Absolute Veränderung
Die Veränderung bezüglich dem vorherigen Wert
1 Jan 1992 Jahr
62.821 Tsnd.
+62.821 Tsnd.
0.0%
1 Jan 1993 Jahr
63.314 Tsnd.
+493.84
0.79%
1 Jan 1994 Jahr
65.542 Tsnd.
+2.227 Tsnd.
3.52%
1 Jan 1995 Jahr
66.067 Tsnd.
+525.227
0.8%
1 Jan 1996 Jahr
66.081 Tsnd.
+14.039
0.02%
1 Jan 1997 Jahr
67.943 Tsnd.
+1.862 Tsnd.
2.82%
1 Jan 1998 Jahr
70.031 Tsnd.
+2.088 Tsnd.
3.07%
1 Jan 1999 Jahr
71.553 Tsnd.
+1.522 Tsnd.
2.17%
1 Jan 2000 Jahr
73.618 Tsnd.
+2.065 Tsnd.
2.89%
1 Jan 2001 Jahr
74.432 Tsnd.
+813.484
1.11%
1 Jan 2002 Jahr
75.151 Tsnd.
+719.758
0.97%
1 Jan 2003 Jahr
76.628 Tsnd.
+1.476 Tsnd.
1.96%
1 Jan 2004 Jahr
77.215 Tsnd.
+587.563
0.77%
1 Jan 2005 Jahr
78.904 Tsnd.
+1.689 Tsnd.
2.19%
1 Jan 2006 Jahr
78.52 Tsnd.
-383.773
-0.49%
1 Jan 2007 Jahr
78.664 Tsnd.
+143.773
0.18%
1 Jan 2008 Jahr
79.037 Tsnd.
+373.234
0.47%
1 Jan 2009 Jahr
79.741 Tsnd.
+703.563
0.89%
1 Jan 2010 Jahr
80.859 Tsnd.
+1.118 Tsnd.
1.4%
1 Jan 2011 Jahr
80.649 Tsnd.
-209.352
-0.26%
1 Jan 2012 Jahr
81.055 Tsnd.
+405.992
0.5%
1 Jan 2013 Jahr
83.412 Tsnd.
+2.356 Tsnd.
2.91%
1 Jan 2014 Jahr
85.137 Tsnd.
+1.726 Tsnd.
2.07%
1 Jan 2015 Jahr
86.972 Tsnd.
+1.835 Tsnd.
2.16%
Bewertung der Länder gemäß mit laufender Statistik nach Jahren

Kommentare:

Abschicken
PremiumAbout & FeedbackVereinbarungPrivatheit
logo
© 2022 Selected Technologies LLC – Morgan Hill, California