29
/de/
de
AIzaSyAYiBZKx7MnpbEhh9jyipgxe19OcubqV5w
April 1, 2024
116892
Cyprus
CYP
true
2
1
GDP per person employed (constant 2011 PPP $)
2015,2014,2013,2012,2011,2010,2009,2008,2007,2006,2005,2004,2003,2002,2001,2000,1999,1998,1997,1996,1995,1994,1993,1992
Download
Bibliothek der Globalstatistik →Cyprus →

GDP per person employed (constant 2011 PPP $)

Diese Statistik in anderen Ländern:
AfghanistanAlbaniaAlgeriaAngolaArab WorldArgentinaArmeniaAustraliaAustriaAzerbaijanBahamas, TheBahrainBangladeshBarbadosBelarusBelgiumBelizeBeninBhutanBoliviaBosnia and HerzegovinaBotswanaBrazilBrunei DarussalamBulgariaBurkina FasoBurundiCabo VerdeCambodiaCameroonCanadaCaribbean small statesCentral African RepublicCentral Europe and the BalticsChadChileChinaColombiaComorosCongo, Dem. Rep.Congo, Rep.Costa RicaCote d'IvoireCroatiaCubaCyprusCzech RepublicDenmarkDominican RepublicEarly-demographic dividendEast Asia & PacificEast Asia & Pacific (excluding high income)East Asia & Pacific (IDA & IBRD countries)EcuadorEgypt, Arab Rep.El SalvadorEquatorial GuineaEritreaEstoniaEthiopiaEuro areaEurope & Central AsiaEurope & Central Asia (excluding high income)Europe & Central Asia (IDA & IBRD countries)European UnionFijiFinlandFragile and conflict affected situationsFranceGabonGambia, TheGeorgiaGermanyGhanaGreeceGuatemalaGuineaGuinea-BissauGuyanaHaitiHeavily indebted poor countries (HIPC)High incomeHondurasHong Kong SAR, ChinaHungaryIBRD onlyIcelandIDA & IBRD totalIDA blendIDA onlyIDA totalIndiaIndonesiaIran, Islamic Rep.IraqIrelandIsraelItalyJamaicaJapanJordanKazakhstanKenyaKorea, Dem. People’s Rep.Korea, Rep.KuwaitKyrgyz RepublicLao PDRLate-demographic dividendLatin America & Caribbean Latin America & Caribbean (excluding high income)Latin America & the Caribbean (IDA & IBRD countries)LatviaLeast developed countries: UN classificationLebanonLesothoLiberiaLibyaLithuaniaLow & middle incomeLow incomeLower middle incomeLuxembourgMacao SAR, ChinaMacedonia, FYRMadagascarMalawiMalaysiaMaldivesMaliMaltaMauritaniaMauritiusMexicoMiddle East & North AfricaMiddle East & North Africa (excluding high income)Middle East & North Africa (IDA & IBRD countries)Middle incomeMoldovaMongoliaMontenegroMoroccoMozambiqueMyanmarNamibiaNepalNetherlandsNew ZealandNicaraguaNigerNigeriaNorth AmericaNorwayOECD membersOmanOther small statesPakistanPanamaPapua New GuineaParaguayPeruPhilippinesPolandPortugalPost-demographic dividendPre-demographic dividendPuerto RicoQatarRomaniaRussian FederationRwandaSaudi ArabiaSenegalSerbiaSierra LeoneSingaporeSlovak RepublicSloveniaSmall statesSolomon IslandsSomaliaSouth AfricaSouth AsiaSouth Asia (IDA & IBRD)SpainSri LankaSub-Saharan Africa Sub-Saharan Africa (excluding high income)Sub-Saharan Africa (IDA & IBRD countries)SudanSurinameSwazilandSwedenSwitzerlandSyrian Arab RepublicTajikistanTanzaniaThailandTimor-LesteTogoTrinidad and TobagoTunisiaTurkeyTurkmenistanUgandaUkraineUnited Arab EmiratesUnited KingdomUnited StatesUpper middle incomeUruguayUzbekistanVenezuela, RBVietnamWest Bank and GazaWorldYemen, Rep.ZambiaZimbabwe
Zeitlinie:
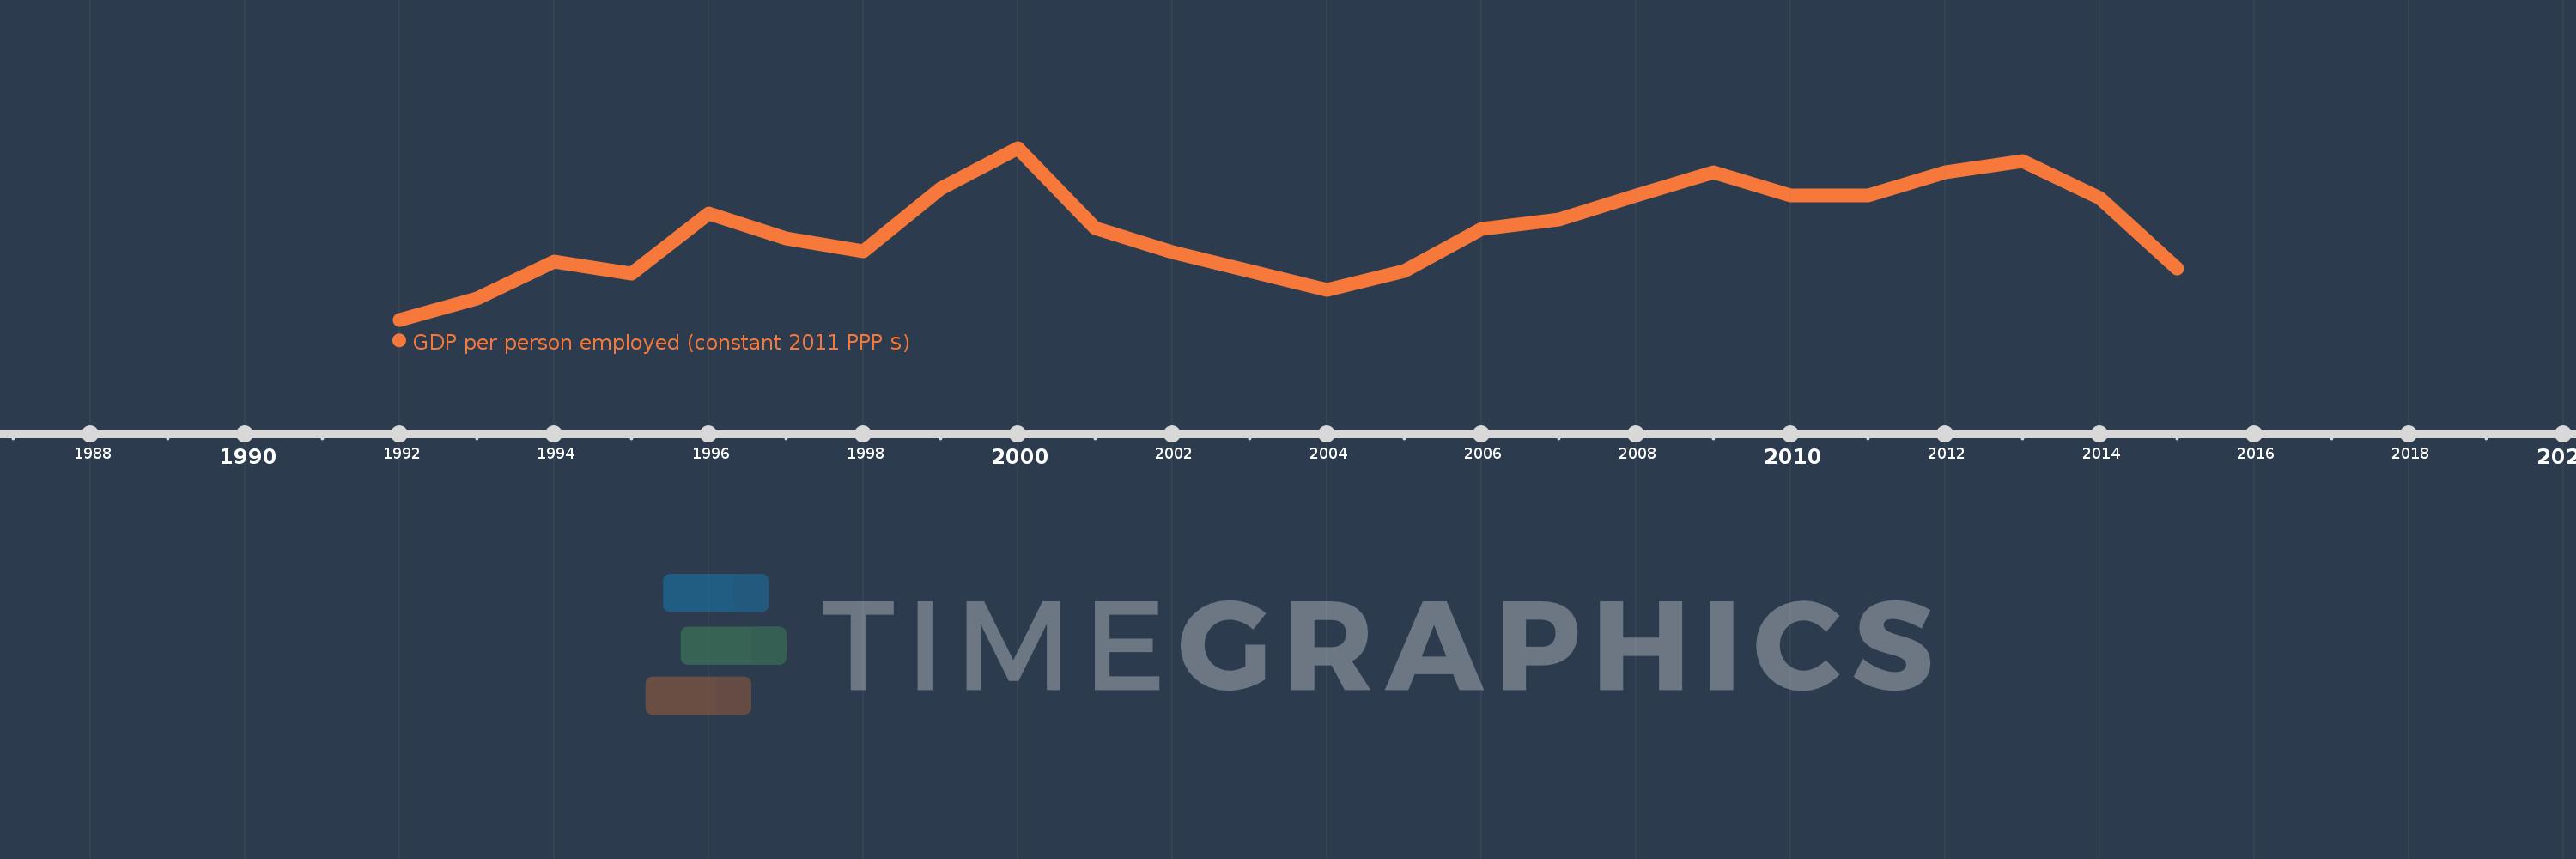
Diese Zeitleiste vorliegt die Graphik ab 1992 J. bis 2015 J. Cyprus. Die Angaben bis 1991 J. sind nicht vorhanden. Die Zahl aktueller Beobachtungen nach Daten: 24.
Die Quelle (Bezeichnung):
Kennzahlen der Weltentwicklung
Die Quelle (Einrichtung):
International Labour Organization, Key Indicators of the Labour Market database.
Kategorien:
Social Protection & Labor
Es wurde aktualisiert:
23 Apr 2017 Jahr
Kennzahlen der Wertänderungen vom Jahr zum Jahr
im Durchschnitt:
47.181 Tsnd.
Minimum:
44.022 Tsnd.
1 Jan 1992 Jahr
Maximum:
50.047 Tsnd.
1 Jan 2000 Jahr
Zum Datum der Beobachtung
Wert
Absolute Veränderung
Die Veränderung bezüglich dem vorherigen Wert
1 Jan 1992 Jahr
44.022 Tsnd.
+44.022 Tsnd.
0.0%
1 Jan 1993 Jahr
44.772 Tsnd.
+750.66
1.71%
1 Jan 1994 Jahr
46.072 Tsnd.
+1.3 Tsnd.
2.9%
1 Jan 1995 Jahr
45.652 Tsnd.
-420.297
-0.91%
1 Jan 1996 Jahr
47.738 Tsnd.
+2.087 Tsnd.
4.57%
1 Jan 1997 Jahr
46.865 Tsnd.
-873.148
-1.83%
1 Jan 1998 Jahr
46.419 Tsnd.
-446.652
-0.95%
1 Jan 1999 Jahr
48.629 Tsnd.
+2.21 Tsnd.
4.76%
1 Jan 2000 Jahr
50.047 Tsnd.
+1.418 Tsnd.
2.92%
1 Jan 2001 Jahr
47.226 Tsnd.
-2.82 Tsnd.
-5.64%
1 Jan 2002 Jahr
46.386 Tsnd.
-840.359
-1.78%
1 Jan 2003 Jahr
45.723 Tsnd.
-662.93
-1.43%
1 Jan 2004 Jahr
45.054 Tsnd.
-669.262
-1.46%
1 Jan 2005 Jahr
45.719 Tsnd.
+665.16
1.48%
1 Jan 2006 Jahr
47.219 Tsnd.
+1.5 Tsnd.
3.28%
1 Jan 2007 Jahr
47.538 Tsnd.
+318.621
0.67%
1 Jan 2008 Jahr
48.374 Tsnd.
+835.918
1.76%
1 Jan 2009 Jahr
49.2 Tsnd.
+826.031
1.71%
1 Jan 2010 Jahr
48.38 Tsnd.
-819.75
-1.67%
1 Jan 2011 Jahr
48.382 Tsnd.
+1.77
0.0%
1 Jan 2012 Jahr
49.205 Tsnd.
+823.211
1.7%
1 Jan 2013 Jahr
49.585 Tsnd.
+380.09
0.77%
1 Jan 2014 Jahr
48.293 Tsnd.
-1.293 Tsnd.
-2.61%
1 Jan 2015 Jahr
45.835 Tsnd.
-2.458 Tsnd.
-5.09%
Bewertung der Länder gemäß mit laufender Statistik nach Jahren

Kommentare:

Abschicken
PremiumAbout & FeedbackVereinbarungPrivatheit
logo
© 2022 Selected Technologies LLC – Morgan Hill, California