29
/de/
de
AIzaSyAYiBZKx7MnpbEhh9jyipgxe19OcubqV5w
April 1, 2024
140389
Ghana
GHA
true
2
1
GDP per person employed (constant 2011 PPP $)
2015,2014,2013,2012,2011,2010,2009,2008,2007,2006,2005,2004,2003,2002,2001,2000,1999,1998,1997,1996,1995,1994,1993,1992
Download
Bibliothek der Globalstatistik →Ghana →

GDP per person employed (constant 2011 PPP $)

Diese Statistik in anderen Ländern:
AfghanistanAlbaniaAlgeriaAngolaArab WorldArgentinaArmeniaAustraliaAustriaAzerbaijanBahamas, TheBahrainBangladeshBarbadosBelarusBelgiumBelizeBeninBhutanBoliviaBosnia and HerzegovinaBotswanaBrazilBrunei DarussalamBulgariaBurkina FasoBurundiCabo VerdeCambodiaCameroonCanadaCaribbean small statesCentral African RepublicCentral Europe and the BalticsChadChileChinaColombiaComorosCongo, Dem. Rep.Congo, Rep.Costa RicaCote d'IvoireCroatiaCubaCyprusCzech RepublicDenmarkDominican RepublicEarly-demographic dividendEast Asia & PacificEast Asia & Pacific (excluding high income)East Asia & Pacific (IDA & IBRD countries)EcuadorEgypt, Arab Rep.El SalvadorEquatorial GuineaEritreaEstoniaEthiopiaEuro areaEurope & Central AsiaEurope & Central Asia (excluding high income)Europe & Central Asia (IDA & IBRD countries)European UnionFijiFinlandFragile and conflict affected situationsFranceGabonGambia, TheGeorgiaGermanyGhanaGreeceGuatemalaGuineaGuinea-BissauGuyanaHaitiHeavily indebted poor countries (HIPC)High incomeHondurasHong Kong SAR, ChinaHungaryIBRD onlyIcelandIDA & IBRD totalIDA blendIDA onlyIDA totalIndiaIndonesiaIran, Islamic Rep.IraqIrelandIsraelItalyJamaicaJapanJordanKazakhstanKenyaKorea, Dem. People’s Rep.Korea, Rep.KuwaitKyrgyz RepublicLao PDRLate-demographic dividendLatin America & Caribbean Latin America & Caribbean (excluding high income)Latin America & the Caribbean (IDA & IBRD countries)LatviaLeast developed countries: UN classificationLebanonLesothoLiberiaLibyaLithuaniaLow & middle incomeLow incomeLower middle incomeLuxembourgMacao SAR, ChinaMacedonia, FYRMadagascarMalawiMalaysiaMaldivesMaliMaltaMauritaniaMauritiusMexicoMiddle East & North AfricaMiddle East & North Africa (excluding high income)Middle East & North Africa (IDA & IBRD countries)Middle incomeMoldovaMongoliaMontenegroMoroccoMozambiqueMyanmarNamibiaNepalNetherlandsNew ZealandNicaraguaNigerNigeriaNorth AmericaNorwayOECD membersOmanOther small statesPakistanPanamaPapua New GuineaParaguayPeruPhilippinesPolandPortugalPost-demographic dividendPre-demographic dividendPuerto RicoQatarRomaniaRussian FederationRwandaSaudi ArabiaSenegalSerbiaSierra LeoneSingaporeSlovak RepublicSloveniaSmall statesSolomon IslandsSomaliaSouth AfricaSouth AsiaSouth Asia (IDA & IBRD)SpainSri LankaSub-Saharan Africa Sub-Saharan Africa (excluding high income)Sub-Saharan Africa (IDA & IBRD countries)SudanSurinameSwazilandSwedenSwitzerlandSyrian Arab RepublicTajikistanTanzaniaThailandTimor-LesteTogoTrinidad and TobagoTunisiaTurkeyTurkmenistanUgandaUkraineUnited Arab EmiratesUnited KingdomUnited StatesUpper middle incomeUruguayUzbekistanVenezuela, RBVietnamWest Bank and GazaWorldYemen, Rep.ZambiaZimbabwe
Zeitlinie:
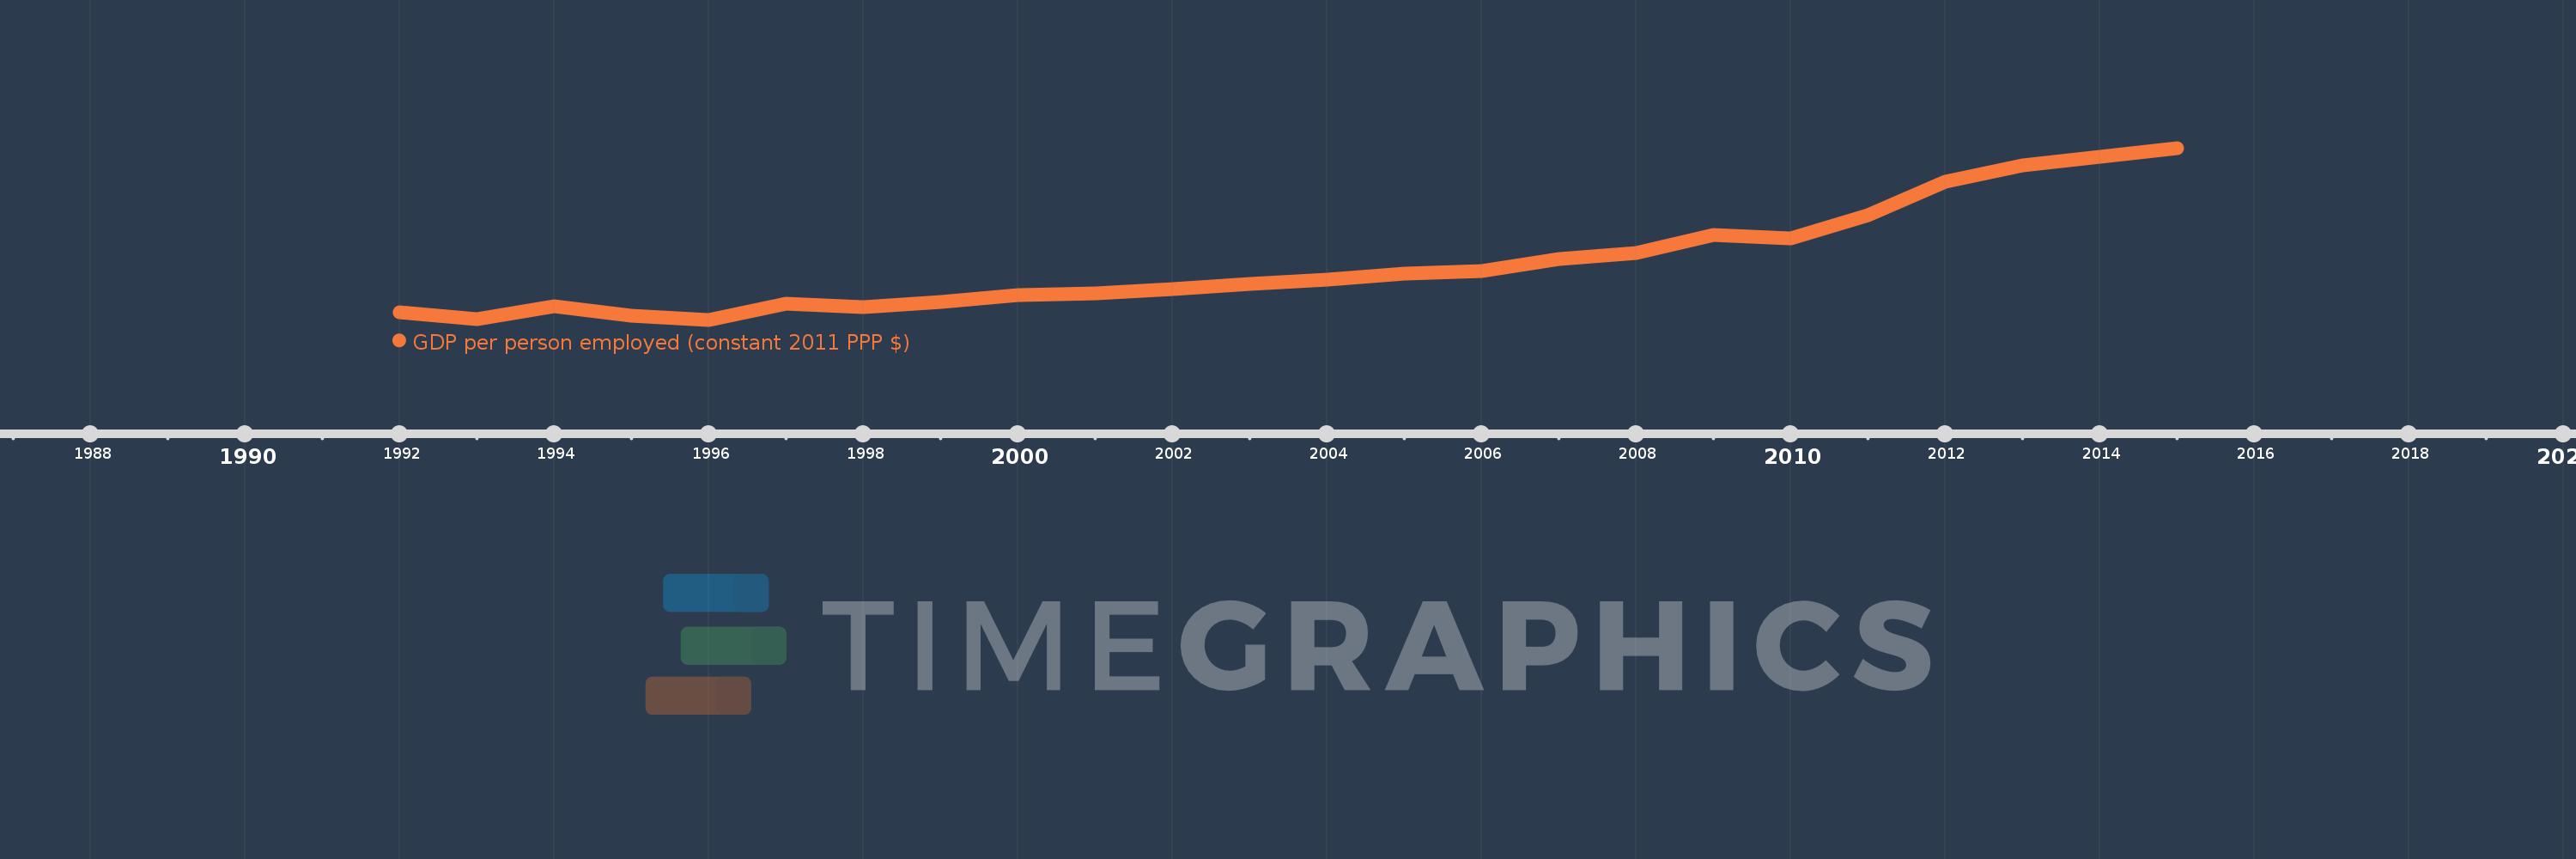
Diese Zeitleiste vorliegt die Graphik ab 1992 J. bis 2015 J. Ghana. Die Angaben bis 1991 J. sind nicht vorhanden. Die Zahl aktueller Beobachtungen nach Daten: 24.
Die Quelle (Bezeichnung):
Kennzahlen der Weltentwicklung
Die Quelle (Einrichtung):
International Labour Organization, Key Indicators of the Labour Market database.
Kategorien:
Social Protection & Labor
Es wurde aktualisiert:
23 Apr 2017 Jahr
Kennzahlen der Wertänderungen vom Jahr zum Jahr
im Durchschnitt:
6.479 Tsnd.
Minimum:
5.057 Tsnd.
1 Jan 1996 Jahr
Maximum:
9.399 Tsnd.
1 Jan 2015 Jahr
Zum Datum der Beobachtung
Wert
Absolute Veränderung
Die Veränderung bezüglich dem vorherigen Wert
1 Jan 1992 Jahr
5.245 Tsnd.
+5.245 Tsnd.
0.0%
1 Jan 1993 Jahr
5.077 Tsnd.
-167.61
-3.2%
1 Jan 1994 Jahr
5.4 Tsnd.
+323.24
6.37%
1 Jan 1995 Jahr
5.16 Tsnd.
-240.63
-4.46%
1 Jan 1996 Jahr
5.057 Tsnd.
-103.01
-2.0%
1 Jan 1997 Jahr
5.472 Tsnd.
+415.15
8.21%
1 Jan 1998 Jahr
5.375 Tsnd.
-96.65
-1.77%
1 Jan 1999 Jahr
5.506 Tsnd.
+130.91
2.44%
1 Jan 2000 Jahr
5.68 Tsnd.
+174.01
3.16%
1 Jan 2001 Jahr
5.715 Tsnd.
+35.3
0.62%
1 Jan 2002 Jahr
5.821 Tsnd.
+105.52
1.85%
1 Jan 2003 Jahr
5.972 Tsnd.
+150.95
2.59%
1 Jan 2004 Jahr
6.073 Tsnd.
+101.57
1.7%
1 Jan 2005 Jahr
6.229 Tsnd.
+155.68
2.56%
1 Jan 2006 Jahr
6.294 Tsnd.
+64.83
1.04%
1 Jan 2007 Jahr
6.583 Tsnd.
+289.06
4.59%
1 Jan 2008 Jahr
6.738 Tsnd.
+155.34
2.36%
1 Jan 2009 Jahr
7.197 Tsnd.
+458.48
6.8%
1 Jan 2010 Jahr
7.109 Tsnd.
-88.27
-1.23%
1 Jan 2011 Jahr
7.701 Tsnd.
+592.23
8.33%
1 Jan 2012 Jahr
8.546 Tsnd.
+845.04
10.97%
1 Jan 2013 Jahr
8.964 Tsnd.
+417.98
4.89%
1 Jan 2014 Jahr
9.179 Tsnd.
+215.68
2.41%
1 Jan 2015 Jahr
9.399 Tsnd.
+219.4
2.39%
Bewertung der Länder gemäß mit laufender Statistik nach Jahren

Kommentare:

Abschicken
PremiumAbout & FeedbackVereinbarungPrivatheit
logo
© 2022 Selected Technologies LLC – Morgan Hill, California