29
/de/
de
AIzaSyAYiBZKx7MnpbEhh9jyipgxe19OcubqV5w
April 1, 2024
216429
Pakistan
PAK
true
2
1
GDP per person employed (constant 2011 PPP $)
2015,2014,2013,2012,2011,2010,2009,2008,2007,2006,2005,2004,2003,2002,2001,2000,1999,1998,1997,1996,1995,1994,1993,1992
Download
Bibliothek der Globalstatistik →Pakistan →

GDP per person employed (constant 2011 PPP $)

Diese Statistik in anderen Ländern:
AfghanistanAlbaniaAlgeriaAngolaArab WorldArgentinaArmeniaAustraliaAustriaAzerbaijanBahamas, TheBahrainBangladeshBarbadosBelarusBelgiumBelizeBeninBhutanBoliviaBosnia and HerzegovinaBotswanaBrazilBrunei DarussalamBulgariaBurkina FasoBurundiCabo VerdeCambodiaCameroonCanadaCaribbean small statesCentral African RepublicCentral Europe and the BalticsChadChileChinaColombiaComorosCongo, Dem. Rep.Congo, Rep.Costa RicaCote d'IvoireCroatiaCubaCyprusCzech RepublicDenmarkDominican RepublicEarly-demographic dividendEast Asia & PacificEast Asia & Pacific (excluding high income)East Asia & Pacific (IDA & IBRD countries)EcuadorEgypt, Arab Rep.El SalvadorEquatorial GuineaEritreaEstoniaEthiopiaEuro areaEurope & Central AsiaEurope & Central Asia (excluding high income)Europe & Central Asia (IDA & IBRD countries)European UnionFijiFinlandFragile and conflict affected situationsFranceGabonGambia, TheGeorgiaGermanyGhanaGreeceGuatemalaGuineaGuinea-BissauGuyanaHaitiHeavily indebted poor countries (HIPC)High incomeHondurasHong Kong SAR, ChinaHungaryIBRD onlyIcelandIDA & IBRD totalIDA blendIDA onlyIDA totalIndiaIndonesiaIran, Islamic Rep.IraqIrelandIsraelItalyJamaicaJapanJordanKazakhstanKenyaKorea, Dem. People’s Rep.Korea, Rep.KuwaitKyrgyz RepublicLao PDRLate-demographic dividendLatin America & Caribbean Latin America & Caribbean (excluding high income)Latin America & the Caribbean (IDA & IBRD countries)LatviaLeast developed countries: UN classificationLebanonLesothoLiberiaLibyaLithuaniaLow & middle incomeLow incomeLower middle incomeLuxembourgMacao SAR, ChinaMacedonia, FYRMadagascarMalawiMalaysiaMaldivesMaliMaltaMauritaniaMauritiusMexicoMiddle East & North AfricaMiddle East & North Africa (excluding high income)Middle East & North Africa (IDA & IBRD countries)Middle incomeMoldovaMongoliaMontenegroMoroccoMozambiqueMyanmarNamibiaNepalNetherlandsNew ZealandNicaraguaNigerNigeriaNorth AmericaNorwayOECD membersOmanOther small statesPakistanPanamaPapua New GuineaParaguayPeruPhilippinesPolandPortugalPost-demographic dividendPre-demographic dividendPuerto RicoQatarRomaniaRussian FederationRwandaSaudi ArabiaSenegalSerbiaSierra LeoneSingaporeSlovak RepublicSloveniaSmall statesSolomon IslandsSomaliaSouth AfricaSouth AsiaSouth Asia (IDA & IBRD)SpainSri LankaSub-Saharan Africa Sub-Saharan Africa (excluding high income)Sub-Saharan Africa (IDA & IBRD countries)SudanSurinameSwazilandSwedenSwitzerlandSyrian Arab RepublicTajikistanTanzaniaThailandTimor-LesteTogoTrinidad and TobagoTunisiaTurkeyTurkmenistanUgandaUkraineUnited Arab EmiratesUnited KingdomUnited StatesUpper middle incomeUruguayUzbekistanVenezuela, RBVietnamWest Bank and GazaWorldYemen, Rep.ZambiaZimbabwe
Zeitlinie:
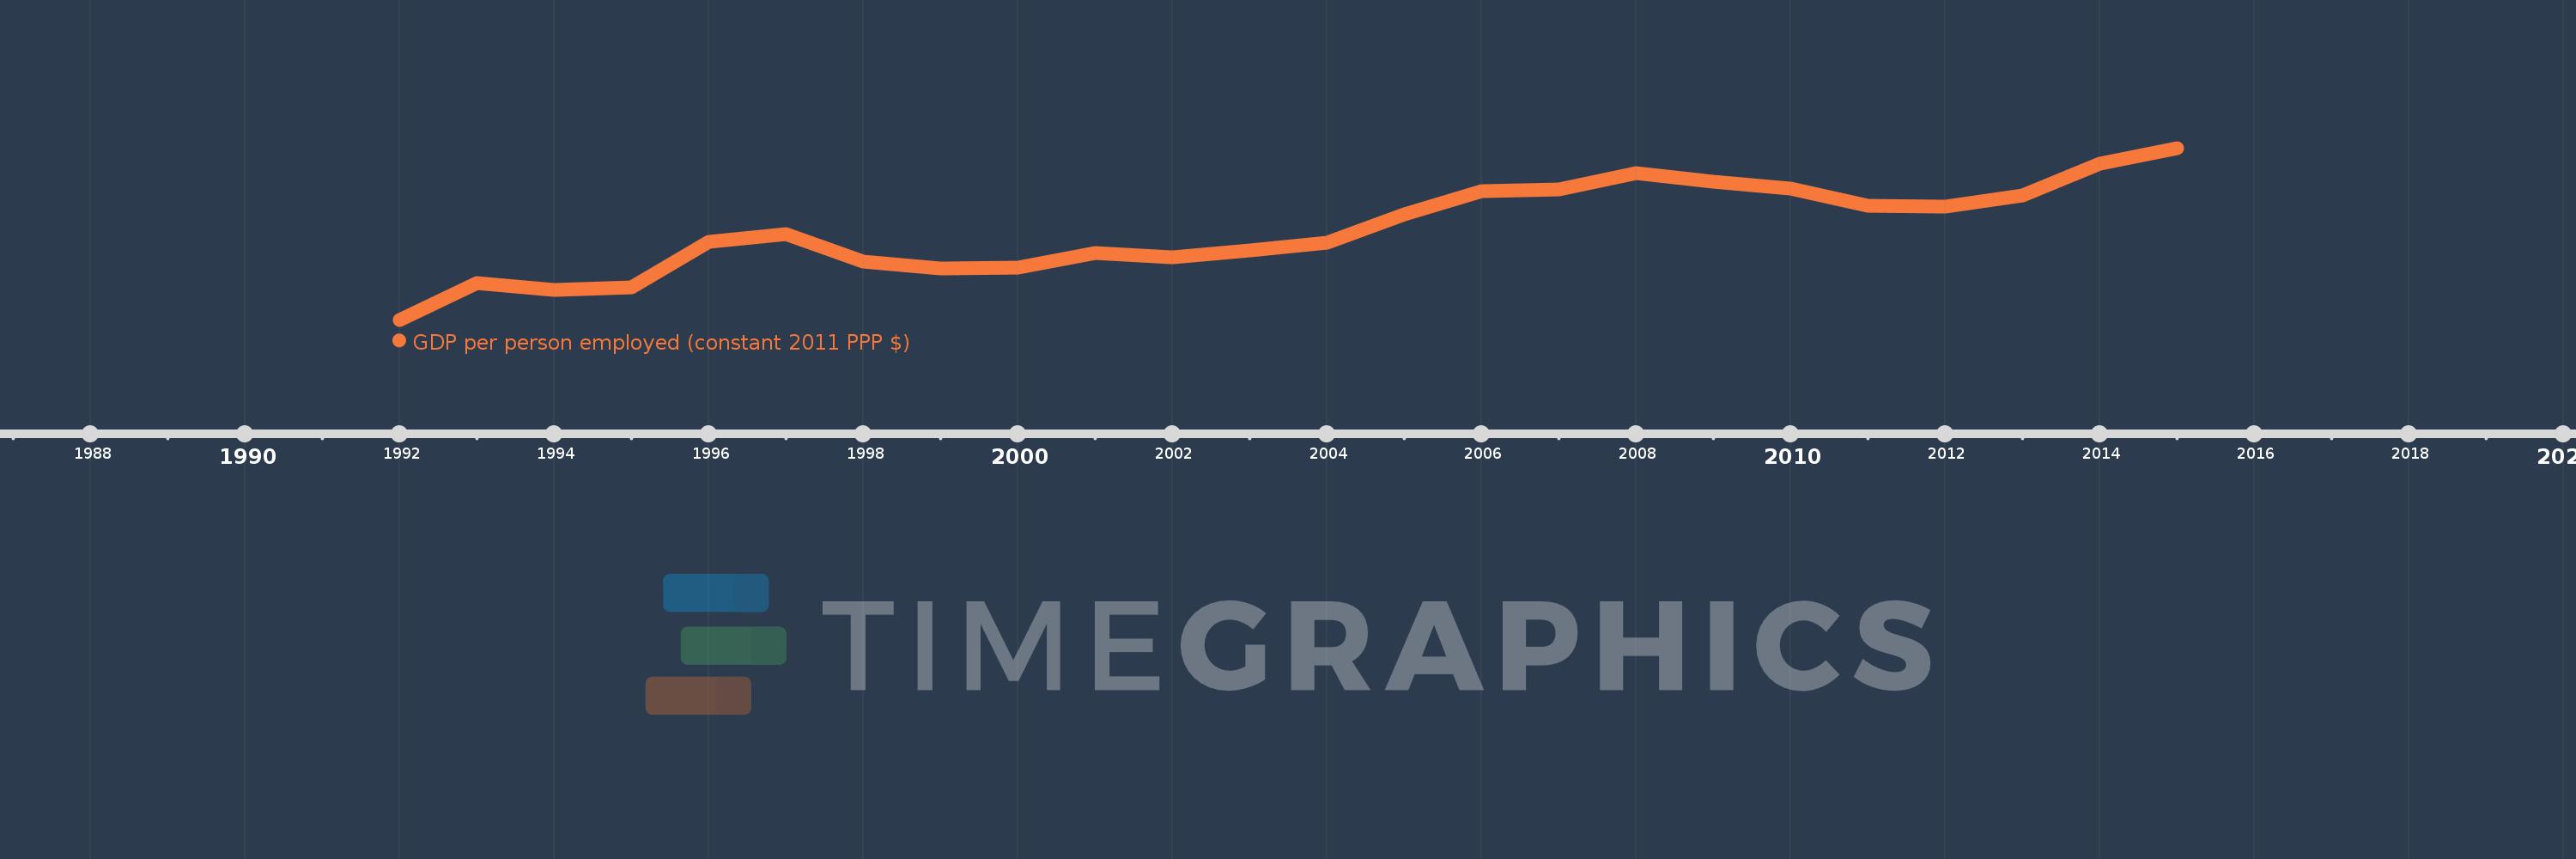
Diese Zeitleiste vorliegt die Graphik ab 1992 J. bis 2015 J. Pakistan. Die Angaben bis 1991 J. sind nicht vorhanden. Die Zahl aktueller Beobachtungen nach Daten: 24.
Die Quelle (Bezeichnung):
Kennzahlen der Weltentwicklung
Die Quelle (Einrichtung):
International Labour Organization, Key Indicators of the Labour Market database.
Kategorien:
Social Protection & Labor
Es wurde aktualisiert:
23 Apr 2017 Jahr
Kennzahlen der Wertänderungen vom Jahr zum Jahr
im Durchschnitt:
12.452 Tsnd.
Minimum:
11.286 Tsnd.
1 Jan 1992 Jahr
Maximum:
13.513 Tsnd.
1 Jan 2015 Jahr
Zum Datum der Beobachtung
Wert
Absolute Veränderung
Die Veränderung bezüglich dem vorherigen Wert
1 Jan 1992 Jahr
11.286 Tsnd.
+11.286 Tsnd.
0.0%
1 Jan 1993 Jahr
11.764 Tsnd.
+478.62
4.24%
1 Jan 1994 Jahr
11.673 Tsnd.
-91.27
-0.78%
1 Jan 1995 Jahr
11.703 Tsnd.
+29.85
0.26%
1 Jan 1996 Jahr
12.295 Tsnd.
+592.12
5.06%
1 Jan 1997 Jahr
12.391 Tsnd.
+95.79
0.78%
1 Jan 1998 Jahr
12.042 Tsnd.
-349.05
-2.82%
1 Jan 1999 Jahr
11.949 Tsnd.
-92.45
-0.77%
1 Jan 2000 Jahr
11.966 Tsnd.
+16.39
0.14%
1 Jan 2001 Jahr
12.151 Tsnd.
+185.69
1.55%
1 Jan 2002 Jahr
12.09 Tsnd.
-61.61
-0.51%
1 Jan 2003 Jahr
12.179 Tsnd.
+89.24
0.74%
1 Jan 2004 Jahr
12.284 Tsnd.
+105.32
0.86%
1 Jan 2005 Jahr
12.653 Tsnd.
+368.55
3.0%
1 Jan 2006 Jahr
12.954 Tsnd.
+300.84
2.38%
1 Jan 2007 Jahr
12.976 Tsnd.
+22.57
0.17%
1 Jan 2008 Jahr
13.189 Tsnd.
+212.27
1.64%
1 Jan 2009 Jahr
13.073 Tsnd.
-115.359
-0.87%
1 Jan 2010 Jahr
12.983 Tsnd.
-90.69
-0.69%
1 Jan 2011 Jahr
12.765 Tsnd.
-217.29
-1.67%
1 Jan 2012 Jahr
12.752 Tsnd.
-12.86
-0.1%
1 Jan 2013 Jahr
12.898 Tsnd.
+145.301
1.14%
1 Jan 2014 Jahr
13.309 Tsnd.
+411.479
3.19%
1 Jan 2015 Jahr
13.513 Tsnd.
+203.39
1.53%
Bewertung der Länder gemäß mit laufender Statistik nach Jahren

Kommentare:

Abschicken
PremiumAbout & FeedbackVereinbarungPrivatheit
logo
© 2022 Selected Technologies LLC – Morgan Hill, California