29
/
en
AIzaSyAYiBZKx7MnpbEhh9jyipgxe19OcubqV5w
April 1, 2024
88554
Bosnia and Herzegovina
BIH
true
2
1
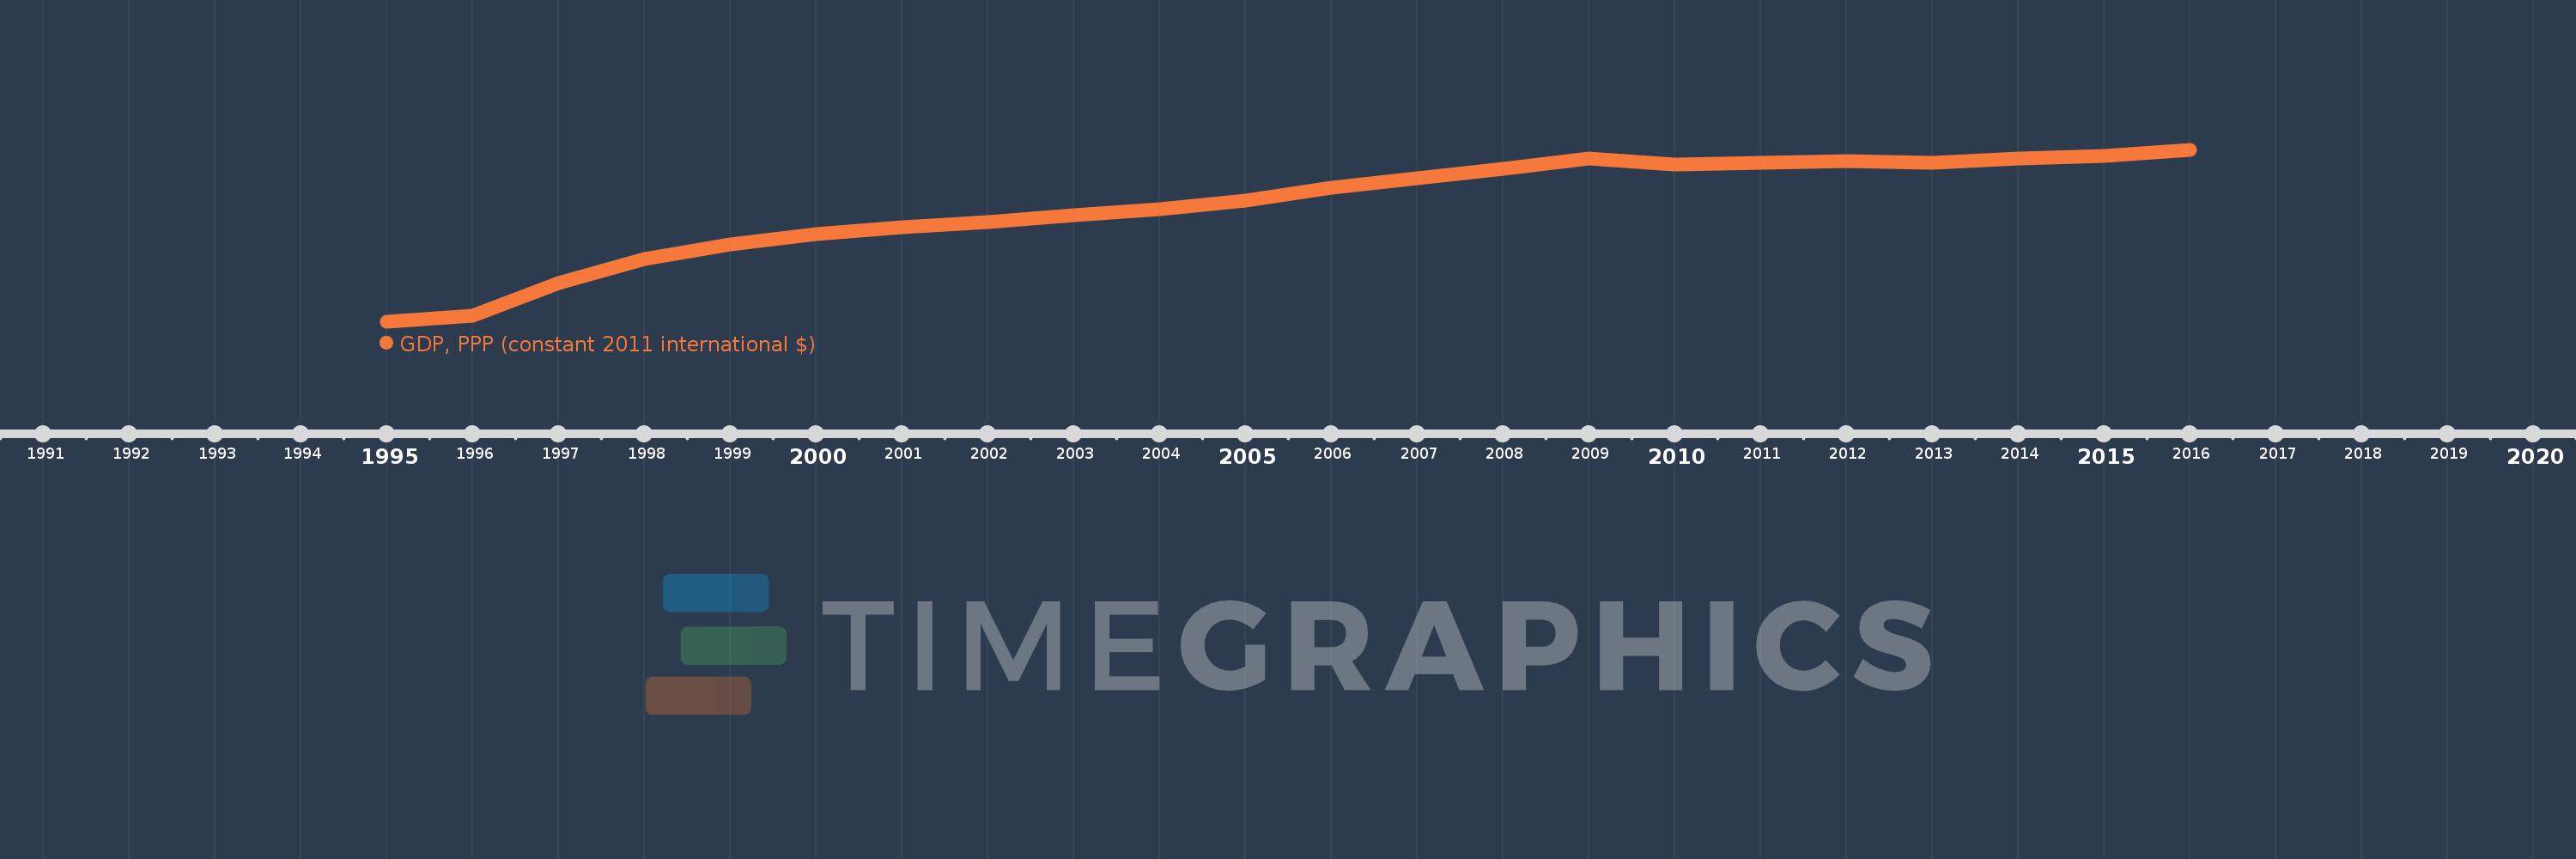
GDP, PPP (constant 2011 international $)
2016,2015,2014,2013,2012,2011,2010,2009,2008,2007,2006,2005,2004,2003,2002,2001,2000,1999,1998,1997,1996,1995
This statistics in other country:
AfghanistanAlbaniaAlgeriaAngolaAntigua and BarbudaArab WorldArgentinaArmeniaArubaAustraliaAustriaAzerbaijanBahamas, TheBahrainBangladeshBarbadosBelarusBelgiumBelizeBeninBermudaBhutanBoliviaBosnia and HerzegovinaBotswanaBrazilBrunei DarussalamBulgariaBurkina FasoBurundiCabo VerdeCambodiaCameroonCanadaCaribbean small statesCayman IslandsCentral African RepublicCentral Europe and the BalticsChadChileChinaColombiaComorosCongo, Dem. Rep.Congo, Rep.Costa RicaCote d'IvoireCroatiaCubaCyprusCzech RepublicDenmarkDjiboutiDominicaDominican RepublicEarly-demographic dividendEast Asia & PacificEast Asia & Pacific (excluding high income)East Asia & Pacific (IDA & IBRD countries)EcuadorEgypt, Arab Rep.El SalvadorEquatorial GuineaEritreaEstoniaEthiopiaEuro areaEurope & Central AsiaEurope & Central Asia (excluding high income)Europe & Central Asia (IDA & IBRD countries)European UnionFijiFinlandFragile and conflict affected situationsFranceGabonGambia, TheGeorgiaGermanyGhanaGreeceGrenadaGuatemalaGuineaGuinea-BissauGuyanaHaitiHeavily indebted poor countries (HIPC)High incomeHondurasHong Kong SAR, ChinaHungaryIBRD onlyIcelandIDA & IBRD totalIDA blendIDA onlyIDA totalIndiaIndonesiaIran, Islamic Rep.IraqIrelandIsraelItalyJamaicaJapanJordanKazakhstanKenyaKiribatiKorea, Rep.KosovoKuwaitKyrgyz RepublicLao PDRLate-demographic dividendLatin America & Caribbean Latin America & Caribbean (excluding high income)Latin America & the Caribbean (IDA & IBRD countries)LatviaLeast developed countries: UN classificationLebanonLesothoLiberiaLibyaLithuaniaLow & middle incomeLow incomeLower middle incomeLuxembourgMacao SAR, ChinaMacedonia, FYRMadagascarMalawiMalaysiaMaldivesMaliMaltaMarshall IslandsMauritaniaMauritiusMexicoMicronesia, Fed. Sts.Middle East & North AfricaMiddle East & North Africa (excluding high income)Middle East & North Africa (IDA & IBRD countries)Middle incomeMoldovaMongoliaMontenegroMoroccoMozambiqueMyanmarNamibiaNauruNepalNetherlandsNew ZealandNicaraguaNigerNigeriaNorth AmericaNorwayOECD membersOmanOther small statesPacific island small statesPakistanPalauPanamaPapua New GuineaParaguayPeruPhilippinesPolandPortugalPost-demographic dividendPre-demographic dividendPuerto RicoQatarRomaniaRussian FederationRwandaSamoaSao Tome and PrincipeSaudi ArabiaSenegalSerbiaSeychellesSierra LeoneSingaporeSint Maarten (Dutch part)Slovak RepublicSloveniaSmall statesSolomon IslandsSouth AfricaSouth AsiaSouth Asia (IDA & IBRD)South SudanSpainSri LankaSt. Kitts and NevisSt. LuciaSt. Vincent and the GrenadinesSub-Saharan Africa Sub-Saharan Africa (excluding high income)Sub-Saharan Africa (IDA & IBRD countries)SudanSurinameSwazilandSwedenSwitzerlandTajikistanTanzaniaThailandTimor-LesteTogoTongaTrinidad and TobagoTunisiaTurkeyTurkmenistanTuvaluUgandaUkraineUnited Arab EmiratesUnited KingdomUnited StatesUpper middle incomeUruguayUzbekistanVanuatuVenezuela, RBVietnamWest Bank and GazaWorldYemen, Rep.ZambiaZimbabwe Timeline:
This timeline shows a graph from 1995 to 2016 of Bosnia and Herzegovina. No data until 1994. Number of actual observations by date: 22.
Source name:
World Development Indicators
Source organization:
World Bank, International Comparison Program database.
Categories, topics:
Economy & Growth
Last updated:
apr 23, 2017
Indicators value changes by year
Minimum:
5.812 bln
jan 1, 1995
Maximum:
38.557 bln
jan 1, 2016
At the date of observation
Value
Absolute change
Change from previous value
jan 1, 1995
5.812 bln
+5.812 bln
0.0%
jan 1, 1996
7.021 bln
+1.209 bln
20.8%
jan 1, 1997
13.268 bln
+6.246 bln
88.96%
jan 1, 1998
17.83 bln
+4.563 bln
34.39%
jan 1, 1999
20.612 bln
+2.782 bln
15.6%
jan 1, 2000
22.59 bln
+1.979 bln
9.6%
jan 1, 2001
23.833 bln
+1.242 bln
5.5%
jan 1, 2002
24.882 bln
+1.049 bln
4.4%
jan 1, 2003
26.2 bln
+1.319 bln
5.3%
jan 1, 2004
27.248 bln
+1.048 bln
4.0%
jan 1, 2005
28.911 bln
+1.662 bln
6.1%
jan 1, 2006
31.443 bln
+2.532 bln
8.76%
jan 1, 2007
33.134 bln
+1.691 bln
5.38%
jan 1, 2008
35.032 bln
+1.898 bln
5.73%
jan 1, 2009
36.952 bln
+1.92 bln
5.48%
jan 1, 2010
35.892 bln
-1.06 bln
-2.87%
jan 1, 2011
36.167 bln
+275.38 mln
0.77%
jan 1, 2012
36.495 bln
+328.486 mln
0.91%
jan 1, 2013
36.155 bln
-340.571 mln
-0.93%
jan 1, 2014
37.021 bln
+865.618 mln
2.39%
jan 1, 2015
37.421 bln
+400.516 mln
1.08%
jan 1, 2016
38.557 bln
+1.136 bln
3.03%
Ranking of countries by current statistics by years


Comments: