29
/
en
AIzaSyAYiBZKx7MnpbEhh9jyipgxe19OcubqV5w
April 1, 2024
222191
Peru
PER
true
2
1
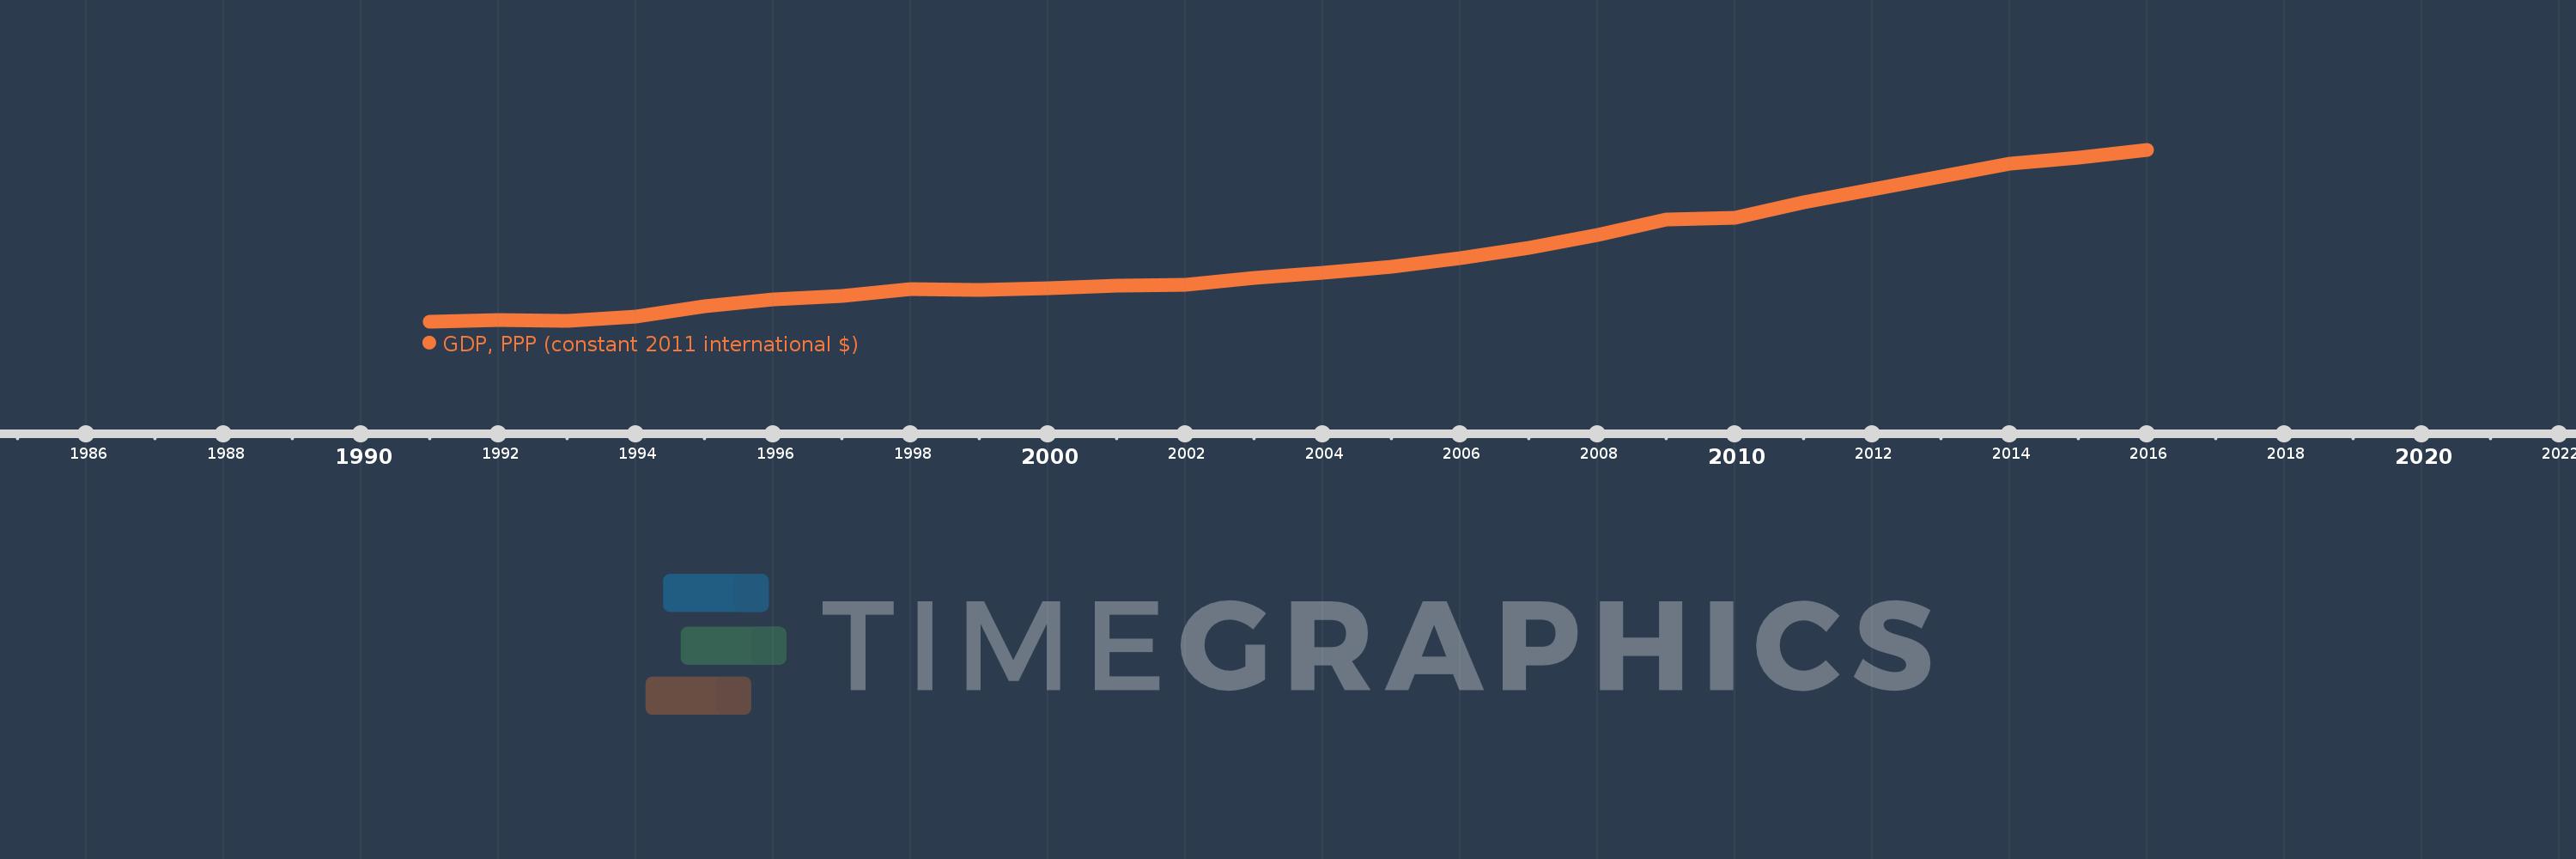
GDP, PPP (constant 2011 international $)
2016,2015,2014,2013,2012,2011,2010,2009,2008,2007,2006,2005,2004,2003,2002,2001,2000,1999,1998,1997,1996,1995,1994,1993,1992,1991
This statistics in other country:
AfghanistanAlbaniaAlgeriaAngolaAntigua and BarbudaArab WorldArgentinaArmeniaArubaAustraliaAustriaAzerbaijanBahamas, TheBahrainBangladeshBarbadosBelarusBelgiumBelizeBeninBermudaBhutanBoliviaBosnia and HerzegovinaBotswanaBrazilBrunei DarussalamBulgariaBurkina FasoBurundiCabo VerdeCambodiaCameroonCanadaCaribbean small statesCayman IslandsCentral African RepublicCentral Europe and the BalticsChadChileChinaColombiaComorosCongo, Dem. Rep.Congo, Rep.Costa RicaCote d'IvoireCroatiaCubaCyprusCzech RepublicDenmarkDjiboutiDominicaDominican RepublicEarly-demographic dividendEast Asia & PacificEast Asia & Pacific (excluding high income)East Asia & Pacific (IDA & IBRD countries)EcuadorEgypt, Arab Rep.El SalvadorEquatorial GuineaEritreaEstoniaEthiopiaEuro areaEurope & Central AsiaEurope & Central Asia (excluding high income)Europe & Central Asia (IDA & IBRD countries)European UnionFijiFinlandFragile and conflict affected situationsFranceGabonGambia, TheGeorgiaGermanyGhanaGreeceGrenadaGuatemalaGuineaGuinea-BissauGuyanaHaitiHeavily indebted poor countries (HIPC)High incomeHondurasHong Kong SAR, ChinaHungaryIBRD onlyIcelandIDA & IBRD totalIDA blendIDA onlyIDA totalIndiaIndonesiaIran, Islamic Rep.IraqIrelandIsraelItalyJamaicaJapanJordanKazakhstanKenyaKiribatiKorea, Rep.KosovoKuwaitKyrgyz RepublicLao PDRLate-demographic dividendLatin America & Caribbean Latin America & Caribbean (excluding high income)Latin America & the Caribbean (IDA & IBRD countries)LatviaLeast developed countries: UN classificationLebanonLesothoLiberiaLibyaLithuaniaLow & middle incomeLow incomeLower middle incomeLuxembourgMacao SAR, ChinaMacedonia, FYRMadagascarMalawiMalaysiaMaldivesMaliMaltaMarshall IslandsMauritaniaMauritiusMexicoMicronesia, Fed. Sts.Middle East & North AfricaMiddle East & North Africa (excluding high income)Middle East & North Africa (IDA & IBRD countries)Middle incomeMoldovaMongoliaMontenegroMoroccoMozambiqueMyanmarNamibiaNauruNepalNetherlandsNew ZealandNicaraguaNigerNigeriaNorth AmericaNorwayOECD membersOmanOther small statesPacific island small statesPakistanPalauPanamaPapua New GuineaParaguayPeruPhilippinesPolandPortugalPost-demographic dividendPre-demographic dividendPuerto RicoQatarRomaniaRussian FederationRwandaSamoaSao Tome and PrincipeSaudi ArabiaSenegalSerbiaSeychellesSierra LeoneSingaporeSint Maarten (Dutch part)Slovak RepublicSloveniaSmall statesSolomon IslandsSouth AfricaSouth AsiaSouth Asia (IDA & IBRD)South SudanSpainSri LankaSt. Kitts and NevisSt. LuciaSt. Vincent and the GrenadinesSub-Saharan Africa Sub-Saharan Africa (excluding high income)Sub-Saharan Africa (IDA & IBRD countries)SudanSurinameSwazilandSwedenSwitzerlandTajikistanTanzaniaThailandTimor-LesteTogoTongaTrinidad and TobagoTunisiaTurkeyTurkmenistanTuvaluUgandaUkraineUnited Arab EmiratesUnited KingdomUnited StatesUpper middle incomeUruguayUzbekistanVanuatuVenezuela, RBVietnamWest Bank and GazaWorldYemen, Rep.ZambiaZimbabwe Timeline:
This timeline shows a graph from 1991 to 2016 of Peru. No data until 1990. Number of actual observations by date: 26.
Source name:
World Development Indicators
Source organization:
World Bank, International Comparison Program database.
Categories, topics:
Economy & Growth
Last updated:
apr 23, 2017
Indicators value changes by year
Minimum:
115.958 bln
jan 1, 1991
Maximum:
369.226 bln
jan 1, 2016
At the date of observation
Value
Absolute change
Change from previous value
jan 1, 1991
115.958 bln
+115.958 bln
0.0%
jan 1, 1992
118.532 bln
+2.573 bln
2.22%
jan 1, 1993
117.891 bln
-640.674 mln
-0.54%
jan 1, 1994
124.073 bln
+6.182 bln
5.24%
jan 1, 1995
139.344 bln
+15.271 bln
12.31%
jan 1, 1996
149.671 bln
+10.327 bln
7.41%
jan 1, 1997
153.86 bln
+4.189 bln
2.8%
jan 1, 1998
163.826 bln
+9.965 bln
6.48%
jan 1, 1999
163.184 bln
-641.439 mln
-0.39%
jan 1, 2000
165.624 bln
+2.439 bln
1.49%
jan 1, 2001
170.086 bln
+4.463 bln
2.69%
jan 1, 2002
171.137 bln
+1.051 bln
0.62%
jan 1, 2003
180.47 bln
+9.333 bln
5.45%
jan 1, 2004
187.987 bln
+7.517 bln
4.17%
jan 1, 2005
197.308 bln
+9.321 bln
4.96%
jan 1, 2006
209.709 bln
+12.401 bln
6.29%
jan 1, 2007
225.497 bln
+15.789 bln
7.53%
jan 1, 2008
244.706 bln
+19.209 bln
8.52%
jan 1, 2009
267.039 bln
+22.333 bln
9.13%
jan 1, 2010
269.966 bln
+2.926 bln
1.1%
jan 1, 2011
292.46 bln
+22.495 bln
8.33%
jan 1, 2012
310.965 bln
+18.505 bln
6.33%
jan 1, 2013
330.057 bln
+19.092 bln
6.14%
jan 1, 2014
349.374 bln
+19.317 bln
5.85%
jan 1, 2015
357.599 bln
+8.225 bln
2.35%
jan 1, 2016
369.226 bln
+11.626 bln
3.25%
Ranking of countries by current statistics by years


Comments: