29
/
en
AIzaSyAYiBZKx7MnpbEhh9jyipgxe19OcubqV5w
April 1, 2024
193032
Mauritania
MRT
true
2
1
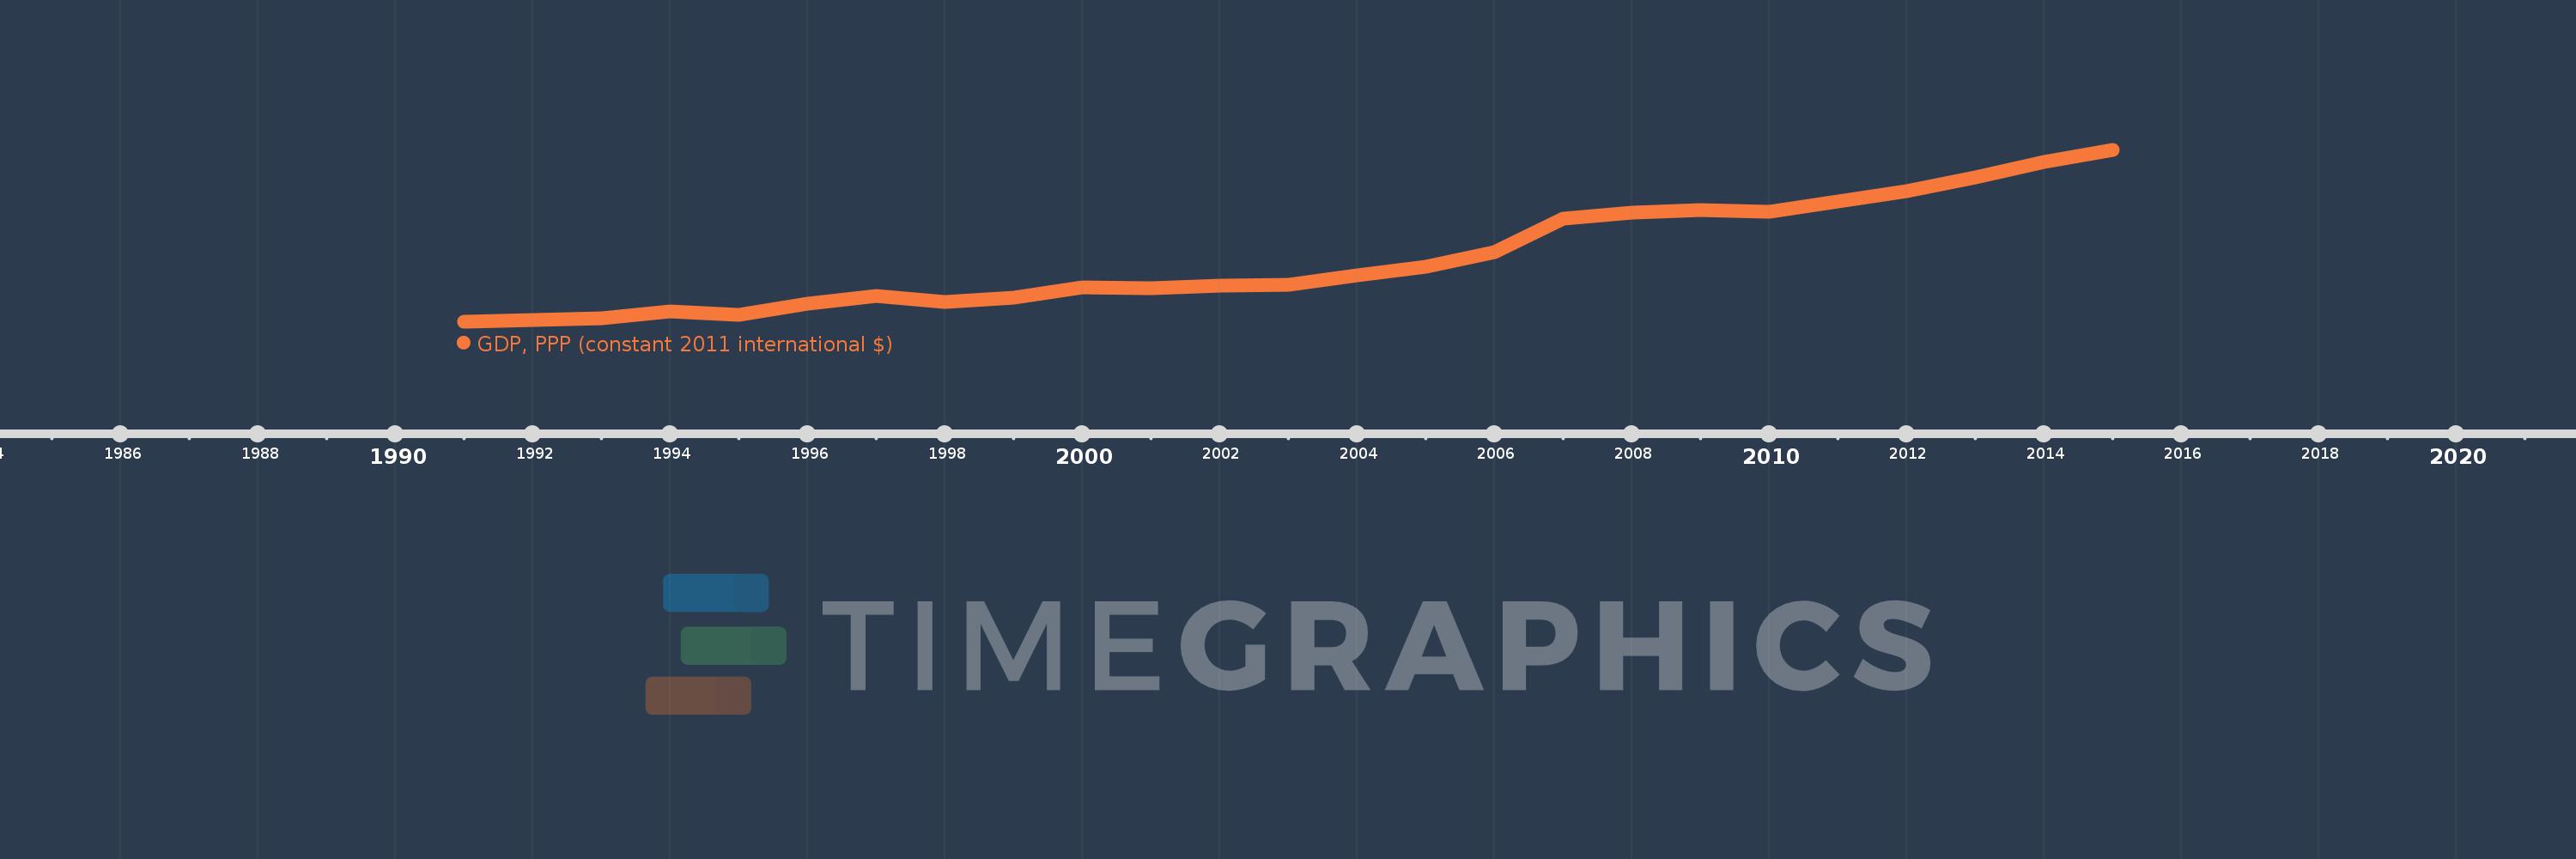
GDP, PPP (constant 2011 international $)
2015,2014,2013,2012,2011,2010,2009,2008,2007,2006,2005,2004,2003,2002,2001,2000,1999,1998,1997,1996,1995,1994,1993,1992,1991
This statistics in other country:
AfghanistanAlbaniaAlgeriaAngolaAntigua and BarbudaArab WorldArgentinaArmeniaArubaAustraliaAustriaAzerbaijanBahamas, TheBahrainBangladeshBarbadosBelarusBelgiumBelizeBeninBermudaBhutanBoliviaBosnia and HerzegovinaBotswanaBrazilBrunei DarussalamBulgariaBurkina FasoBurundiCabo VerdeCambodiaCameroonCanadaCaribbean small statesCayman IslandsCentral African RepublicCentral Europe and the BalticsChadChileChinaColombiaComorosCongo, Dem. Rep.Congo, Rep.Costa RicaCote d'IvoireCroatiaCubaCyprusCzech RepublicDenmarkDjiboutiDominicaDominican RepublicEarly-demographic dividendEast Asia & PacificEast Asia & Pacific (excluding high income)East Asia & Pacific (IDA & IBRD countries)EcuadorEgypt, Arab Rep.El SalvadorEquatorial GuineaEritreaEstoniaEthiopiaEuro areaEurope & Central AsiaEurope & Central Asia (excluding high income)Europe & Central Asia (IDA & IBRD countries)European UnionFijiFinlandFragile and conflict affected situationsFranceGabonGambia, TheGeorgiaGermanyGhanaGreeceGrenadaGuatemalaGuineaGuinea-BissauGuyanaHaitiHeavily indebted poor countries (HIPC)High incomeHondurasHong Kong SAR, ChinaHungaryIBRD onlyIcelandIDA & IBRD totalIDA blendIDA onlyIDA totalIndiaIndonesiaIran, Islamic Rep.IraqIrelandIsraelItalyJamaicaJapanJordanKazakhstanKenyaKiribatiKorea, Rep.KosovoKuwaitKyrgyz RepublicLao PDRLate-demographic dividendLatin America & Caribbean Latin America & Caribbean (excluding high income)Latin America & the Caribbean (IDA & IBRD countries)LatviaLeast developed countries: UN classificationLebanonLesothoLiberiaLibyaLithuaniaLow & middle incomeLow incomeLower middle incomeLuxembourgMacao SAR, ChinaMacedonia, FYRMadagascarMalawiMalaysiaMaldivesMaliMaltaMarshall IslandsMauritaniaMauritiusMexicoMicronesia, Fed. Sts.Middle East & North AfricaMiddle East & North Africa (excluding high income)Middle East & North Africa (IDA & IBRD countries)Middle incomeMoldovaMongoliaMontenegroMoroccoMozambiqueMyanmarNamibiaNauruNepalNetherlandsNew ZealandNicaraguaNigerNigeriaNorth AmericaNorwayOECD membersOmanOther small statesPacific island small statesPakistanPalauPanamaPapua New GuineaParaguayPeruPhilippinesPolandPortugalPost-demographic dividendPre-demographic dividendPuerto RicoQatarRomaniaRussian FederationRwandaSamoaSao Tome and PrincipeSaudi ArabiaSenegalSerbiaSeychellesSierra LeoneSingaporeSint Maarten (Dutch part)Slovak RepublicSloveniaSmall statesSolomon IslandsSouth AfricaSouth AsiaSouth Asia (IDA & IBRD)South SudanSpainSri LankaSt. Kitts and NevisSt. LuciaSt. Vincent and the GrenadinesSub-Saharan Africa Sub-Saharan Africa (excluding high income)Sub-Saharan Africa (IDA & IBRD countries)SudanSurinameSwazilandSwedenSwitzerlandTajikistanTanzaniaThailandTimor-LesteTogoTongaTrinidad and TobagoTunisiaTurkeyTurkmenistanTuvaluUgandaUkraineUnited Arab EmiratesUnited KingdomUnited StatesUpper middle incomeUruguayUzbekistanVanuatuVenezuela, RBVietnamWest Bank and GazaWorldYemen, Rep.ZambiaZimbabwe Timeline:
This timeline shows a graph from 1991 to 2015 of Mauritania. No data until 1990. Number of actual observations by date: 25.
Source name:
World Development Indicators
Source organization:
World Bank, International Comparison Program database.
Categories, topics:
Economy & Growth
Last updated:
apr 23, 2017
Indicators value changes by year
Minimum:
5.698 bln
jan 1, 1991
Maximum:
14.662 bln
jan 1, 2015
At the date of observation
Value
Absolute change
Change from previous value
jan 1, 1991
5.698 bln
+5.698 bln
0.0%
jan 1, 1992
5.8 bln
+101.886 mln
1.79%
jan 1, 1993
5.909 bln
+108.698 mln
1.87%
jan 1, 1994
6.256 bln
+347.053 mln
5.87%
jan 1, 1995
6.064 bln
-191.47 mln
-3.06%
jan 1, 1996
6.66 bln
+595.495 mln
9.82%
jan 1, 1997
7.047 bln
+387.518 mln
5.82%
jan 1, 1998
6.762 bln
-285.04 mln
-4.04%
jan 1, 1999
6.95 bln
+187.841 mln
2.78%
jan 1, 2000
7.486 bln
+536.045 mln
7.71%
jan 1, 2001
7.454 bln
-32.221 mln
-0.43%
jan 1, 2002
7.604 bln
+149.733 mln
2.01%
jan 1, 2003
7.654 bln
+50.564 mln
0.67%
jan 1, 2004
8.112 bln
+457.585 mln
5.98%
jan 1, 2005
8.578 bln
+466.217 mln
5.75%
jan 1, 2006
9.347 bln
+769.394 mln
8.97%
jan 1, 2007
11.111 bln
+1.764 bln
18.87%
jan 1, 2008
11.424 bln
+313.093 mln
2.82%
jan 1, 2009
11.548 bln
+123.378 mln
1.08%
jan 1, 2010
11.427 bln
-120.335 mln
-1.04%
jan 1, 2011
11.973 bln
+545.503 mln
4.77%
jan 1, 2012
12.536 bln
+563.207 mln
4.7%
jan 1, 2013
13.262 bln
+726.469 mln
5.8%
jan 1, 2014
14.07 bln
+807.717 mln
6.09%
jan 1, 2015
14.662 bln
+591.821 mln
4.21%
Ranking of countries by current statistics by years


Comments: