29
/
en
AIzaSyAYiBZKx7MnpbEhh9jyipgxe19OcubqV5w
April 1, 2024
54786
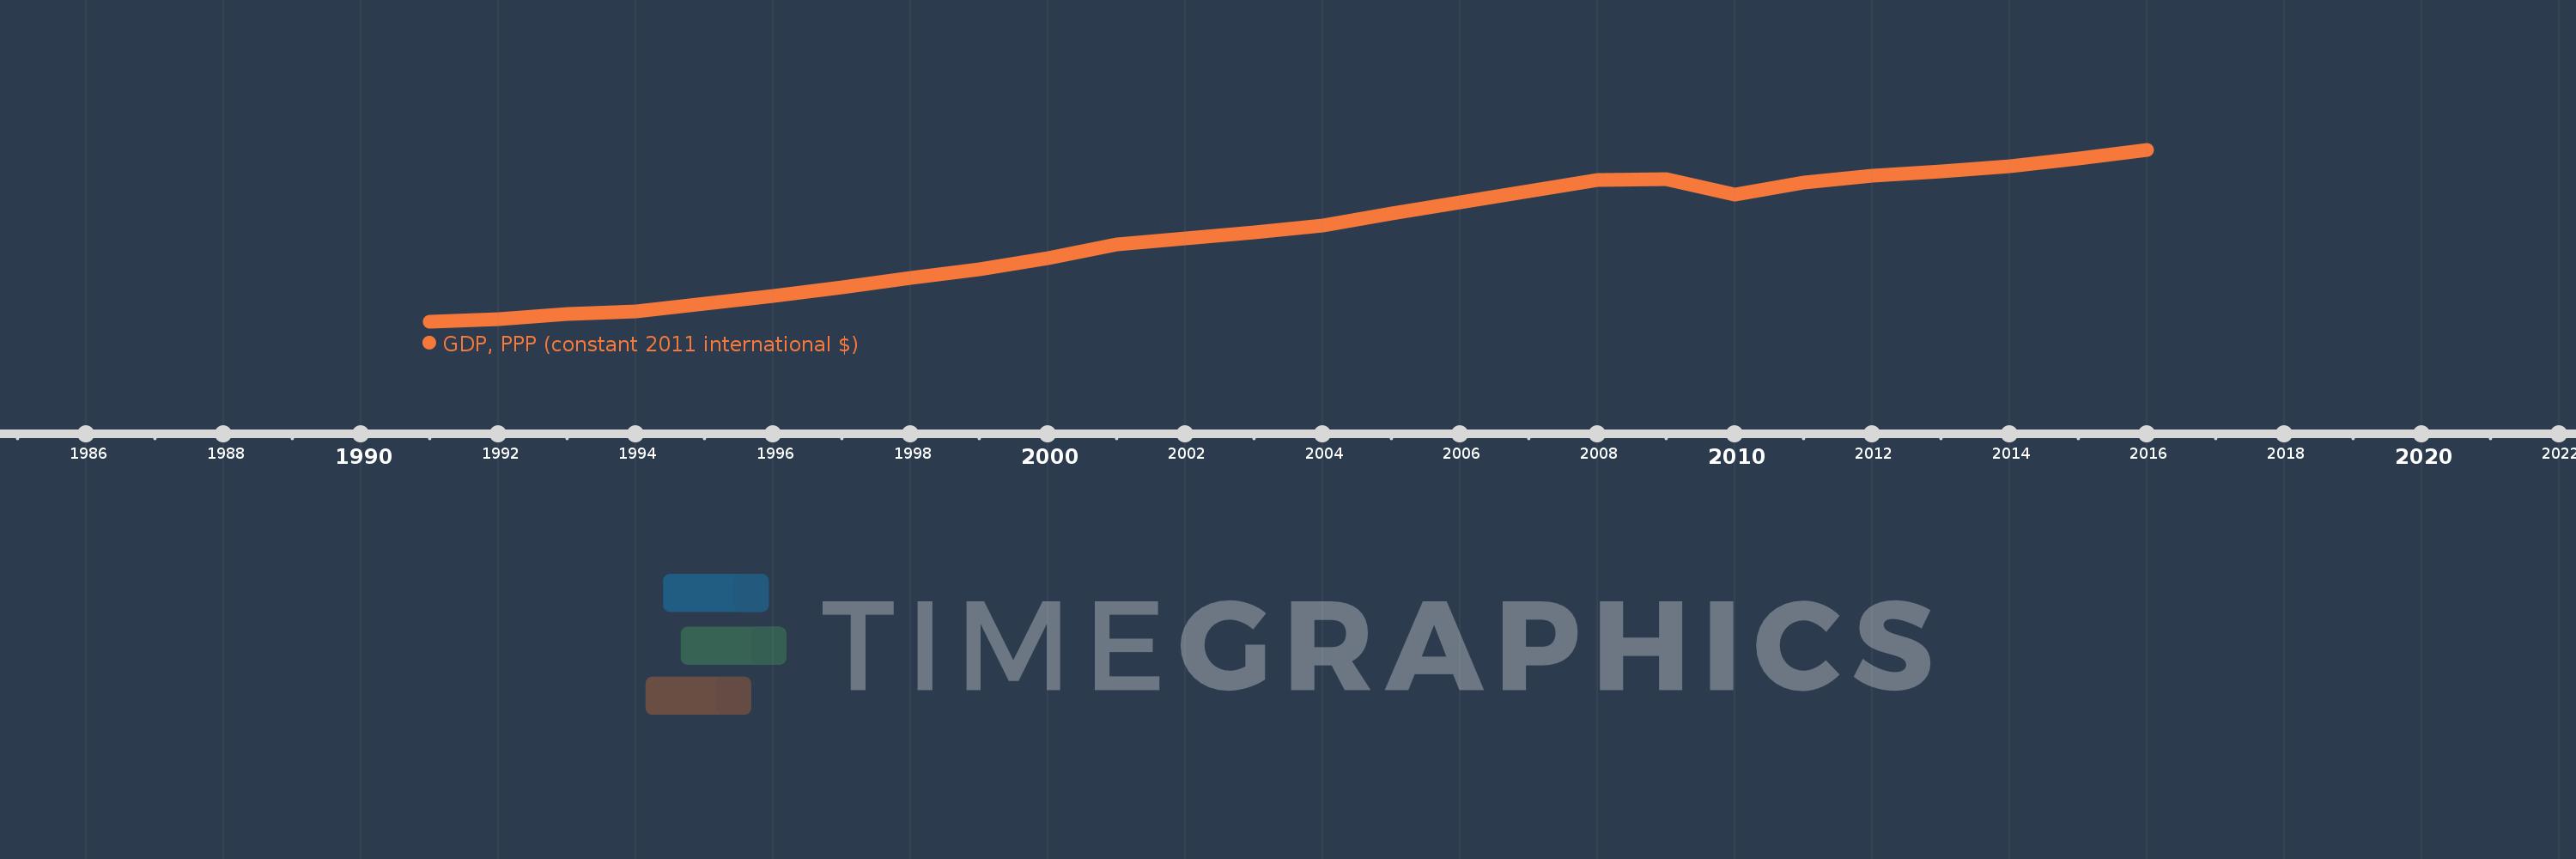
Post-demographic dividend
PST
false
2
1
GDP, PPP (constant 2011 international $)
2016,2015,2014,2013,2012,2011,2010,2009,2008,2007,2006,2005,2004,2003,2002,2001,2000,1999,1998,1997,1996,1995,1994,1993,1992,1991
This statistics in other country:
AfghanistanAlbaniaAlgeriaAngolaAntigua and BarbudaArab WorldArgentinaArmeniaArubaAustraliaAustriaAzerbaijanBahamas, TheBahrainBangladeshBarbadosBelarusBelgiumBelizeBeninBermudaBhutanBoliviaBosnia and HerzegovinaBotswanaBrazilBrunei DarussalamBulgariaBurkina FasoBurundiCabo VerdeCambodiaCameroonCanadaCaribbean small statesCayman IslandsCentral African RepublicCentral Europe and the BalticsChadChileChinaColombiaComorosCongo, Dem. Rep.Congo, Rep.Costa RicaCote d'IvoireCroatiaCubaCyprusCzech RepublicDenmarkDjiboutiDominicaDominican RepublicEarly-demographic dividendEast Asia & PacificEast Asia & Pacific (excluding high income)East Asia & Pacific (IDA & IBRD countries)EcuadorEgypt, Arab Rep.El SalvadorEquatorial GuineaEritreaEstoniaEthiopiaEuro areaEurope & Central AsiaEurope & Central Asia (excluding high income)Europe & Central Asia (IDA & IBRD countries)European UnionFijiFinlandFragile and conflict affected situationsFranceGabonGambia, TheGeorgiaGermanyGhanaGreeceGrenadaGuatemalaGuineaGuinea-BissauGuyanaHaitiHeavily indebted poor countries (HIPC)High incomeHondurasHong Kong SAR, ChinaHungaryIBRD onlyIcelandIDA & IBRD totalIDA blendIDA onlyIDA totalIndiaIndonesiaIran, Islamic Rep.IraqIrelandIsraelItalyJamaicaJapanJordanKazakhstanKenyaKiribatiKorea, Rep.KosovoKuwaitKyrgyz RepublicLao PDRLate-demographic dividendLatin America & Caribbean Latin America & Caribbean (excluding high income)Latin America & the Caribbean (IDA & IBRD countries)LatviaLeast developed countries: UN classificationLebanonLesothoLiberiaLibyaLithuaniaLow & middle incomeLow incomeLower middle incomeLuxembourgMacao SAR, ChinaMacedonia, FYRMadagascarMalawiMalaysiaMaldivesMaliMaltaMarshall IslandsMauritaniaMauritiusMexicoMicronesia, Fed. Sts.Middle East & North AfricaMiddle East & North Africa (excluding high income)Middle East & North Africa (IDA & IBRD countries)Middle incomeMoldovaMongoliaMontenegroMoroccoMozambiqueMyanmarNamibiaNauruNepalNetherlandsNew ZealandNicaraguaNigerNigeriaNorth AmericaNorwayOECD membersOmanOther small statesPacific island small statesPakistanPalauPanamaPapua New GuineaParaguayPeruPhilippinesPolandPortugalPost-demographic dividendPre-demographic dividendPuerto RicoQatarRomaniaRussian FederationRwandaSamoaSao Tome and PrincipeSaudi ArabiaSenegalSerbiaSeychellesSierra LeoneSingaporeSint Maarten (Dutch part)Slovak RepublicSloveniaSmall statesSolomon IslandsSouth AfricaSouth AsiaSouth Asia (IDA & IBRD)South SudanSpainSri LankaSt. Kitts and NevisSt. LuciaSt. Vincent and the GrenadinesSub-Saharan Africa Sub-Saharan Africa (excluding high income)Sub-Saharan Africa (IDA & IBRD countries)SudanSurinameSwazilandSwedenSwitzerlandTajikistanTanzaniaThailandTimor-LesteTogoTongaTrinidad and TobagoTunisiaTurkeyTurkmenistanTuvaluUgandaUkraineUnited Arab EmiratesUnited KingdomUnited StatesUpper middle incomeUruguayUzbekistanVanuatuVenezuela, RBVietnamWest Bank and GazaWorldYemen, Rep.ZambiaZimbabwe Timeline:
This timeline shows a graph from 1991 to 2016 of Post-demographic dividend. No data until 1990. Number of actual observations by date: 26.
Source name:
World Development Indicators
Source organization:
World Bank, International Comparison Program database.
Categories, topics:
Economy & Growth
Last updated:
apr 23, 2017
Indicators value changes by year
Minimum:
27.566 trl
jan 1, 1991
Maximum:
44.916 trl
jan 1, 2016
At the date of observation
Value
Absolute change
Change from previous value
jan 1, 1991
27.566 trl
+27.566 trl
0.0%
jan 1, 1992
27.854 trl
+288.219 bln
1.05%
jan 1, 1993
28.33 trl
+475.95 bln
1.71%
jan 1, 1994
28.597 trl
+266.826 bln
0.94%
jan 1, 1995
29.4 trl
+803.187 bln
2.81%
jan 1, 1996
30.177 trl
+776.58 bln
2.64%
jan 1, 1997
31.038 trl
+860.949 bln
2.85%
jan 1, 1998
32.058 trl
+1.02 trl
3.29%
jan 1, 1999
32.898 trl
+840.905 bln
2.62%
jan 1, 2000
34.031 trl
+1.132 trl
3.44%
jan 1, 2001
35.407 trl
+1.376 trl
4.04%
jan 1, 2002
35.98 trl
+572.881 bln
1.62%
jan 1, 2003
36.579 trl
+598.825 bln
1.66%
jan 1, 2004
37.336 trl
+757.919 bln
2.07%
jan 1, 2005
38.556 trl
+1.22 trl
3.27%
jan 1, 2006
39.613 trl
+1.057 trl
2.74%
jan 1, 2007
40.803 trl
+1.19 trl
3.0%
jan 1, 2008
41.863 trl
+1.06 trl
2.6%
jan 1, 2009
41.966 trl
+102.692 bln
0.25%
jan 1, 2010
40.461 trl
-1.505 trl
-3.59%
jan 1, 2011
41.615 trl
+1.154 trl
2.85%
jan 1, 2012
42.309 trl
+693.705 bln
1.67%
jan 1, 2013
42.772 trl
+463.246 bln
1.09%
jan 1, 2014
43.307 trl
+534.897 bln
1.25%
jan 1, 2015
44.074 trl
+767.579 bln
1.77%
jan 1, 2016
44.916 trl
+841.986 bln
1.91%
Ranking of countries by current statistics by years


Comments: