29
/
en
AIzaSyAYiBZKx7MnpbEhh9jyipgxe19OcubqV5w
April 1, 2024
217492
Palau
PLW
true
2
1
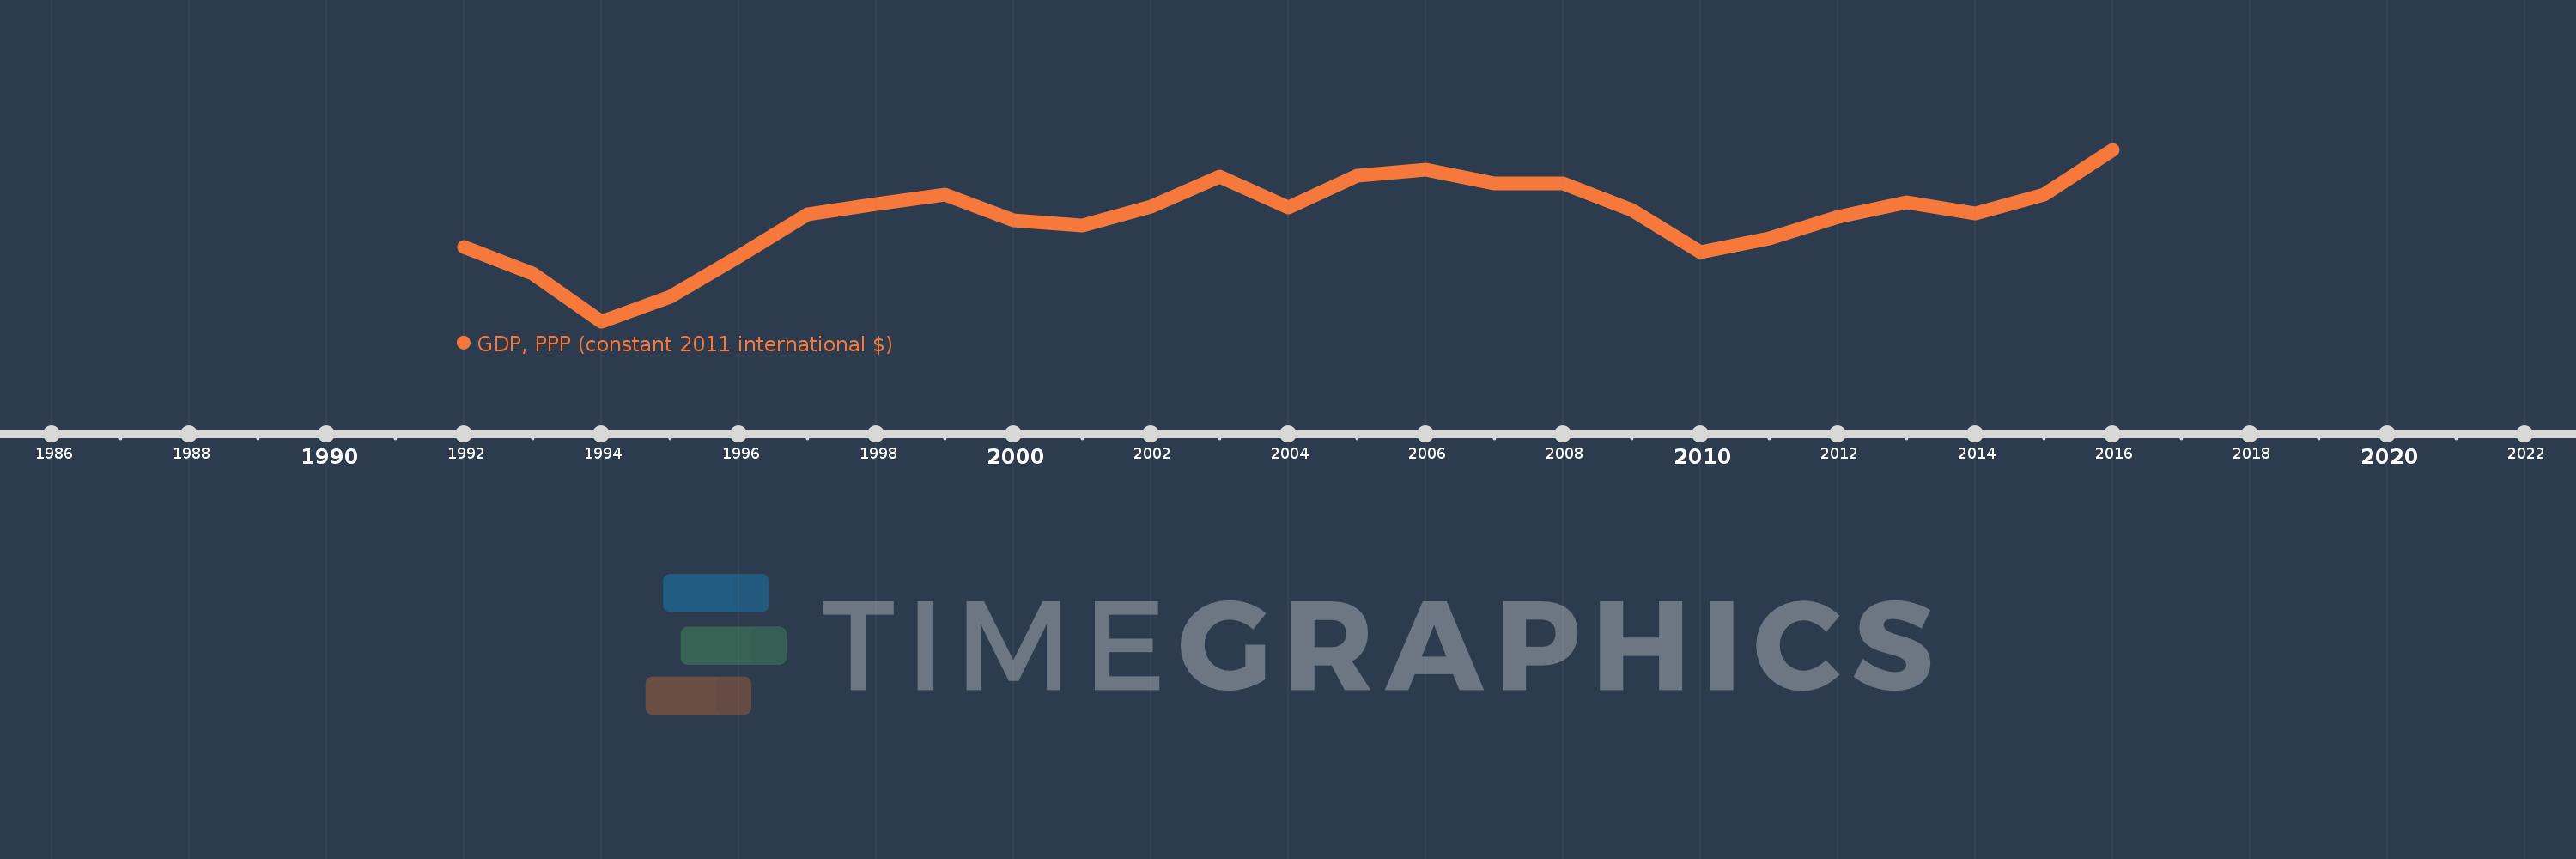
GDP, PPP (constant 2011 international $)
2016,2015,2014,2013,2012,2011,2010,2009,2008,2007,2006,2005,2004,2003,2002,2001,2000,1999,1998,1997,1996,1995,1994,1993,1992
This statistics in other country:
AfghanistanAlbaniaAlgeriaAngolaAntigua and BarbudaArab WorldArgentinaArmeniaArubaAustraliaAustriaAzerbaijanBahamas, TheBahrainBangladeshBarbadosBelarusBelgiumBelizeBeninBermudaBhutanBoliviaBosnia and HerzegovinaBotswanaBrazilBrunei DarussalamBulgariaBurkina FasoBurundiCabo VerdeCambodiaCameroonCanadaCaribbean small statesCayman IslandsCentral African RepublicCentral Europe and the BalticsChadChileChinaColombiaComorosCongo, Dem. Rep.Congo, Rep.Costa RicaCote d'IvoireCroatiaCubaCyprusCzech RepublicDenmarkDjiboutiDominicaDominican RepublicEarly-demographic dividendEast Asia & PacificEast Asia & Pacific (excluding high income)East Asia & Pacific (IDA & IBRD countries)EcuadorEgypt, Arab Rep.El SalvadorEquatorial GuineaEritreaEstoniaEthiopiaEuro areaEurope & Central AsiaEurope & Central Asia (excluding high income)Europe & Central Asia (IDA & IBRD countries)European UnionFijiFinlandFragile and conflict affected situationsFranceGabonGambia, TheGeorgiaGermanyGhanaGreeceGrenadaGuatemalaGuineaGuinea-BissauGuyanaHaitiHeavily indebted poor countries (HIPC)High incomeHondurasHong Kong SAR, ChinaHungaryIBRD onlyIcelandIDA & IBRD totalIDA blendIDA onlyIDA totalIndiaIndonesiaIran, Islamic Rep.IraqIrelandIsraelItalyJamaicaJapanJordanKazakhstanKenyaKiribatiKorea, Rep.KosovoKuwaitKyrgyz RepublicLao PDRLate-demographic dividendLatin America & Caribbean Latin America & Caribbean (excluding high income)Latin America & the Caribbean (IDA & IBRD countries)LatviaLeast developed countries: UN classificationLebanonLesothoLiberiaLibyaLithuaniaLow & middle incomeLow incomeLower middle incomeLuxembourgMacao SAR, ChinaMacedonia, FYRMadagascarMalawiMalaysiaMaldivesMaliMaltaMarshall IslandsMauritaniaMauritiusMexicoMicronesia, Fed. Sts.Middle East & North AfricaMiddle East & North Africa (excluding high income)Middle East & North Africa (IDA & IBRD countries)Middle incomeMoldovaMongoliaMontenegroMoroccoMozambiqueMyanmarNamibiaNauruNepalNetherlandsNew ZealandNicaraguaNigerNigeriaNorth AmericaNorwayOECD membersOmanOther small statesPacific island small statesPakistanPalauPanamaPapua New GuineaParaguayPeruPhilippinesPolandPortugalPost-demographic dividendPre-demographic dividendPuerto RicoQatarRomaniaRussian FederationRwandaSamoaSao Tome and PrincipeSaudi ArabiaSenegalSerbiaSeychellesSierra LeoneSingaporeSint Maarten (Dutch part)Slovak RepublicSloveniaSmall statesSolomon IslandsSouth AfricaSouth AsiaSouth Asia (IDA & IBRD)South SudanSpainSri LankaSt. Kitts and NevisSt. LuciaSt. Vincent and the GrenadinesSub-Saharan Africa Sub-Saharan Africa (excluding high income)Sub-Saharan Africa (IDA & IBRD countries)SudanSurinameSwazilandSwedenSwitzerlandTajikistanTanzaniaThailandTimor-LesteTogoTongaTrinidad and TobagoTunisiaTurkeyTurkmenistanTuvaluUgandaUkraineUnited Arab EmiratesUnited KingdomUnited StatesUpper middle incomeUruguayUzbekistanVanuatuVenezuela, RBVietnamWest Bank and GazaWorldYemen, Rep.ZambiaZimbabwe Timeline:
This timeline shows a graph from 1992 to 2016 of Palau. No data until 1991. Number of actual observations by date: 25.
Source name:
World Development Indicators
Source organization:
World Bank, International Comparison Program database.
Categories, topics:
Economy & Growth
Last updated:
apr 23, 2017
Indicators value changes by year
Minimum:
204.192 mln
jan 1, 1994
Maximum:
306.292 mln
jan 1, 2016
At the date of observation
Value
Absolute change
Change from previous value
jan 1, 1992
248.75 mln
+248.75 mln
0.0%
jan 1, 1993
232.83 mln
-15.92 mln
-6.4%
jan 1, 1994
204.192 mln
-28.638 mln
-12.3%
jan 1, 1995
219.098 mln
+14.906 mln
7.3%
jan 1, 1996
242.98 mln
+23.882 mln
10.9%
jan 1, 1997
268.249 mln
+25.27 mln
10.4%
jan 1, 1998
274.419 mln
+6.17 mln
2.3%
jan 1, 1999
279.907 mln
+5.488 mln
2.0%
jan 1, 2000
264.793 mln
-15.115 mln
-5.4%
jan 1, 2001
261.316 mln
-3.477 mln
-1.31%
jan 1, 2002
272.598 mln
+11.282 mln
4.32%
jan 1, 2003
290.588 mln
+17.99 mln
6.6%
jan 1, 2004
272.141 mln
-18.448 mln
-6.35%
jan 1, 2005
291.046 mln
+18.905 mln
6.95%
jan 1, 2006
294.705 mln
+3.659 mln
1.26%
jan 1, 2007
286.624 mln
-8.08 mln
-2.74%
jan 1, 2008
286.472 mln
-152.46K
-0.05%
jan 1, 2009
270.464 mln
-16.008 mln
-5.59%
jan 1, 2010
245.918 mln
-24.546 mln
-9.08%
jan 1, 2011
253.998 mln
+8.08 mln
3.29%
jan 1, 2012
266.805 mln
+12.807 mln
5.04%
jan 1, 2013
275.342 mln
+8.538 mln
3.2%
jan 1, 2014
268.634 mln
-6.708 mln
-2.44%
jan 1, 2015
280.069 mln
+11.434 mln
4.26%
jan 1, 2016
306.292 mln
+26.223 mln
9.36%
Ranking of countries by current statistics by years


Comments: