29
/
en
AIzaSyAYiBZKx7MnpbEhh9jyipgxe19OcubqV5w
April 1, 2024
31594
Europe & Central Asia (excluding high income)
ECA
false
2
1
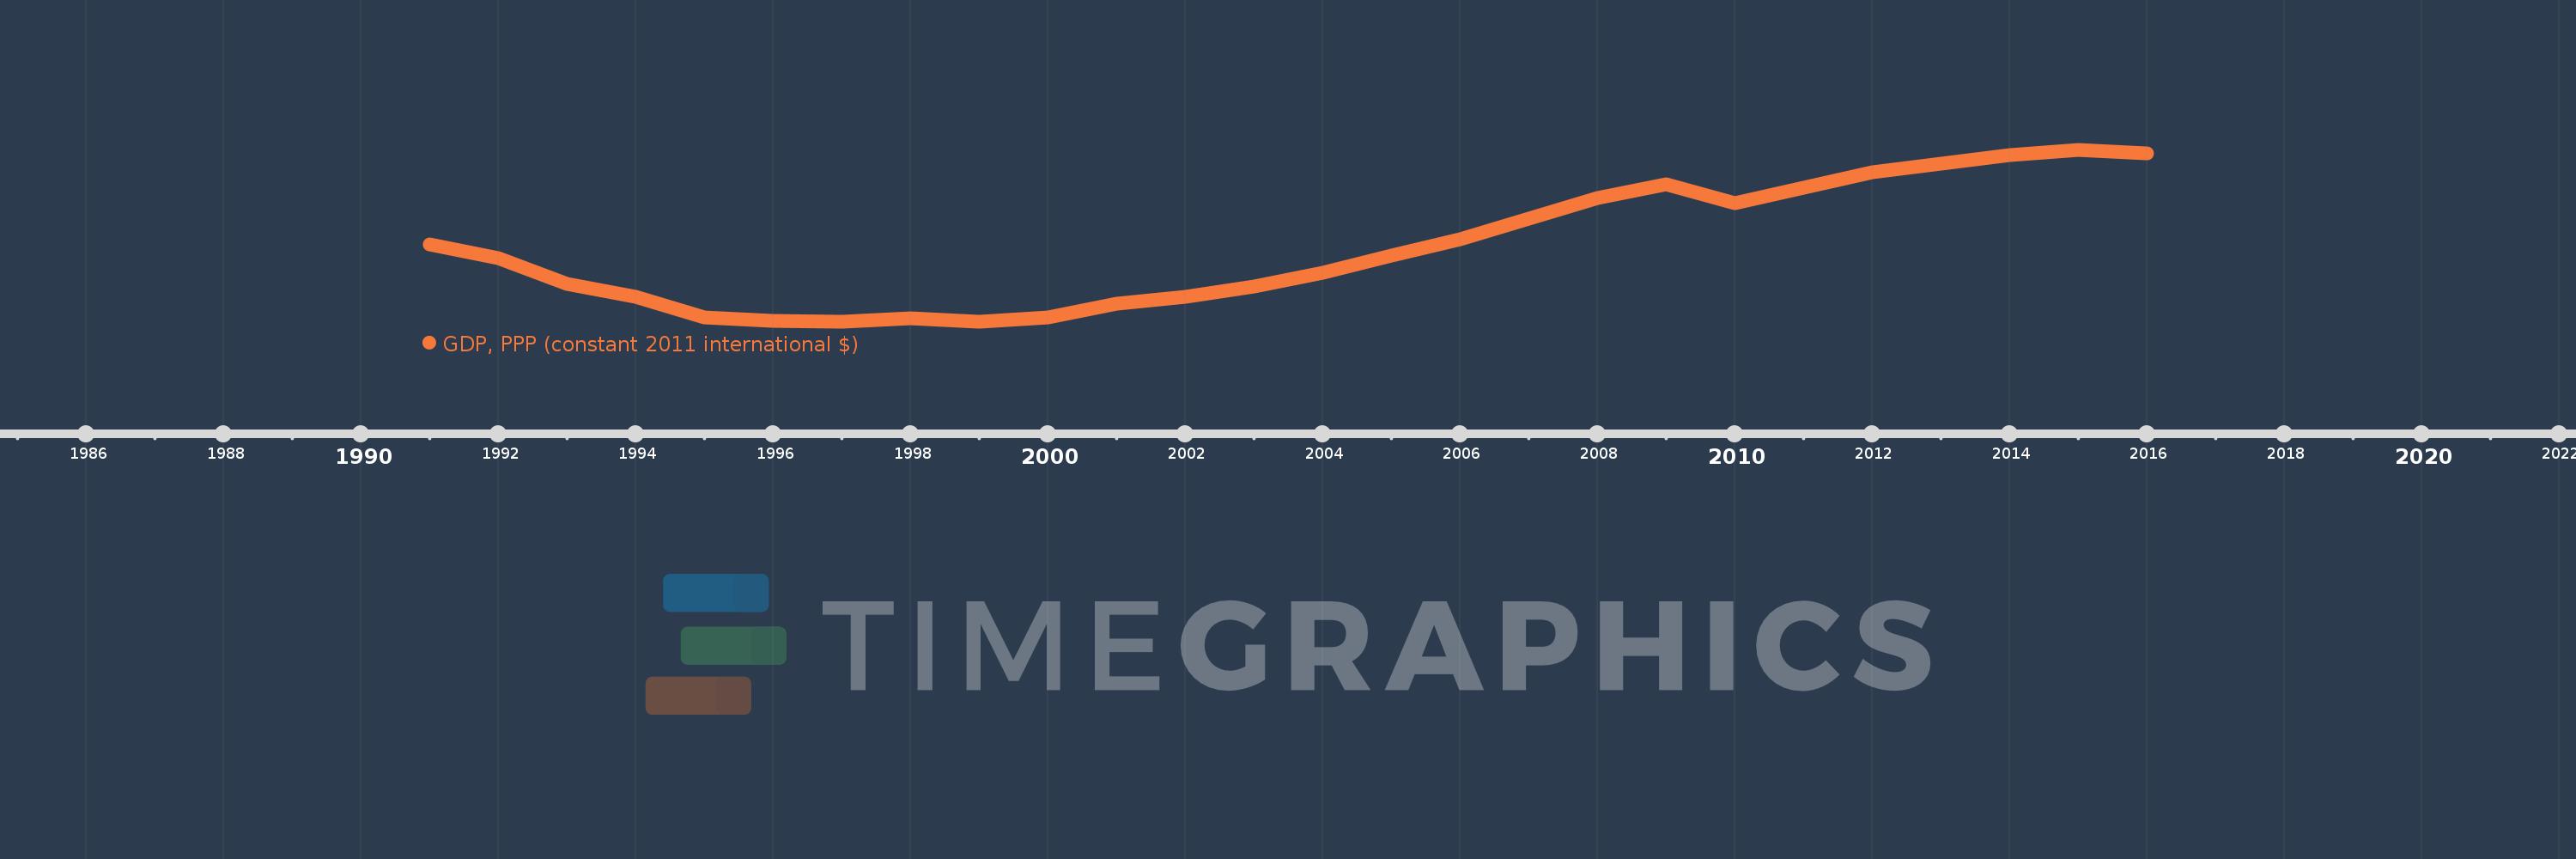
GDP, PPP (constant 2011 international $)
2016,2015,2014,2013,2012,2011,2010,2009,2008,2007,2006,2005,2004,2003,2002,2001,2000,1999,1998,1997,1996,1995,1994,1993,1992,1991
This statistics in other country:
AfghanistanAlbaniaAlgeriaAngolaAntigua and BarbudaArab WorldArgentinaArmeniaArubaAustraliaAustriaAzerbaijanBahamas, TheBahrainBangladeshBarbadosBelarusBelgiumBelizeBeninBermudaBhutanBoliviaBosnia and HerzegovinaBotswanaBrazilBrunei DarussalamBulgariaBurkina FasoBurundiCabo VerdeCambodiaCameroonCanadaCaribbean small statesCayman IslandsCentral African RepublicCentral Europe and the BalticsChadChileChinaColombiaComorosCongo, Dem. Rep.Congo, Rep.Costa RicaCote d'IvoireCroatiaCubaCyprusCzech RepublicDenmarkDjiboutiDominicaDominican RepublicEarly-demographic dividendEast Asia & PacificEast Asia & Pacific (excluding high income)East Asia & Pacific (IDA & IBRD countries)EcuadorEgypt, Arab Rep.El SalvadorEquatorial GuineaEritreaEstoniaEthiopiaEuro areaEurope & Central AsiaEurope & Central Asia (excluding high income)Europe & Central Asia (IDA & IBRD countries)European UnionFijiFinlandFragile and conflict affected situationsFranceGabonGambia, TheGeorgiaGermanyGhanaGreeceGrenadaGuatemalaGuineaGuinea-BissauGuyanaHaitiHeavily indebted poor countries (HIPC)High incomeHondurasHong Kong SAR, ChinaHungaryIBRD onlyIcelandIDA & IBRD totalIDA blendIDA onlyIDA totalIndiaIndonesiaIran, Islamic Rep.IraqIrelandIsraelItalyJamaicaJapanJordanKazakhstanKenyaKiribatiKorea, Rep.KosovoKuwaitKyrgyz RepublicLao PDRLate-demographic dividendLatin America & Caribbean Latin America & Caribbean (excluding high income)Latin America & the Caribbean (IDA & IBRD countries)LatviaLeast developed countries: UN classificationLebanonLesothoLiberiaLibyaLithuaniaLow & middle incomeLow incomeLower middle incomeLuxembourgMacao SAR, ChinaMacedonia, FYRMadagascarMalawiMalaysiaMaldivesMaliMaltaMarshall IslandsMauritaniaMauritiusMexicoMicronesia, Fed. Sts.Middle East & North AfricaMiddle East & North Africa (excluding high income)Middle East & North Africa (IDA & IBRD countries)Middle incomeMoldovaMongoliaMontenegroMoroccoMozambiqueMyanmarNamibiaNauruNepalNetherlandsNew ZealandNicaraguaNigerNigeriaNorth AmericaNorwayOECD membersOmanOther small statesPacific island small statesPakistanPalauPanamaPapua New GuineaParaguayPeruPhilippinesPolandPortugalPost-demographic dividendPre-demographic dividendPuerto RicoQatarRomaniaRussian FederationRwandaSamoaSao Tome and PrincipeSaudi ArabiaSenegalSerbiaSeychellesSierra LeoneSingaporeSint Maarten (Dutch part)Slovak RepublicSloveniaSmall statesSolomon IslandsSouth AfricaSouth AsiaSouth Asia (IDA & IBRD)South SudanSpainSri LankaSt. Kitts and NevisSt. LuciaSt. Vincent and the GrenadinesSub-Saharan Africa Sub-Saharan Africa (excluding high income)Sub-Saharan Africa (IDA & IBRD countries)SudanSurinameSwazilandSwedenSwitzerlandTajikistanTanzaniaThailandTimor-LesteTogoTongaTrinidad and TobagoTunisiaTurkeyTurkmenistanTuvaluUgandaUkraineUnited Arab EmiratesUnited KingdomUnited StatesUpper middle incomeUruguayUzbekistanVanuatuVenezuela, RBVietnamWest Bank and GazaWorldYemen, Rep.ZambiaZimbabwe Timeline:
This timeline shows a graph from 1991 to 2016 of Europe & Central Asia (excluding high income). No data until 1990. Number of actual observations by date: 26.
Source name:
World Development Indicators
Source organization:
World Bank, International Comparison Program database.
Categories, topics:
Economy & Growth
Last updated:
apr 23, 2017
Indicators value changes by year
Minimum:
3.574 trl
jan 1, 1997
Maximum:
7.271 trl
jan 1, 2015
At the date of observation
Value
Absolute change
Change from previous value
jan 1, 1991
5.237 trl
+5.237 trl
0.0%
jan 1, 1992
4.949 trl
-288.402 bln
-5.51%
jan 1, 1993
4.399 trl
-549.807 bln
-11.11%
jan 1, 1994
4.119 trl
-279.347 bln
-6.35%
jan 1, 1995
3.666 trl
-453.376 bln
-11.01%
jan 1, 1996
3.593 trl
-72.997 bln
-1.99%
jan 1, 1997
3.574 trl
-19.022 bln
-0.53%
jan 1, 1998
3.657 trl
+82.886 bln
2.32%
jan 1, 1999
3.586 trl
-70.75 bln
-1.93%
jan 1, 2000
3.677 trl
+90.678 bln
2.53%
jan 1, 2001
3.974 trl
+297.505 bln
8.09%
jan 1, 2002
4.11 trl
+135.812 bln
3.42%
jan 1, 2003
4.331 trl
+220.426 bln
5.36%
jan 1, 2004
4.628 trl
+297.334 bln
6.87%
jan 1, 2005
5.007 trl
+378.869 bln
8.19%
jan 1, 2006
5.351 trl
+344.578 bln
6.88%
jan 1, 2007
5.791 trl
+439.352 bln
8.21%
jan 1, 2008
6.247 trl
+456.685 bln
7.89%
jan 1, 2009
6.537 trl
+289.318 bln
4.63%
jan 1, 2010
6.138 trl
-398.247 bln
-6.09%
jan 1, 2011
6.456 trl
+318.002 bln
5.18%
jan 1, 2012
6.791 trl
+334.495 bln
5.18%
jan 1, 2013
6.987 trl
+196.553 bln
2.89%
jan 1, 2014
7.166 trl
+178.675 bln
2.56%
jan 1, 2015
7.271 trl
+104.61 bln
1.46%
jan 1, 2016
7.204 trl
-66.732 bln
-0.92%
Ranking of countries by current statistics by years


Comments: