29
/
en
AIzaSyAYiBZKx7MnpbEhh9jyipgxe19OcubqV5w
April 1, 2024
27292
East Asia & Pacific
EAS
false
2
1
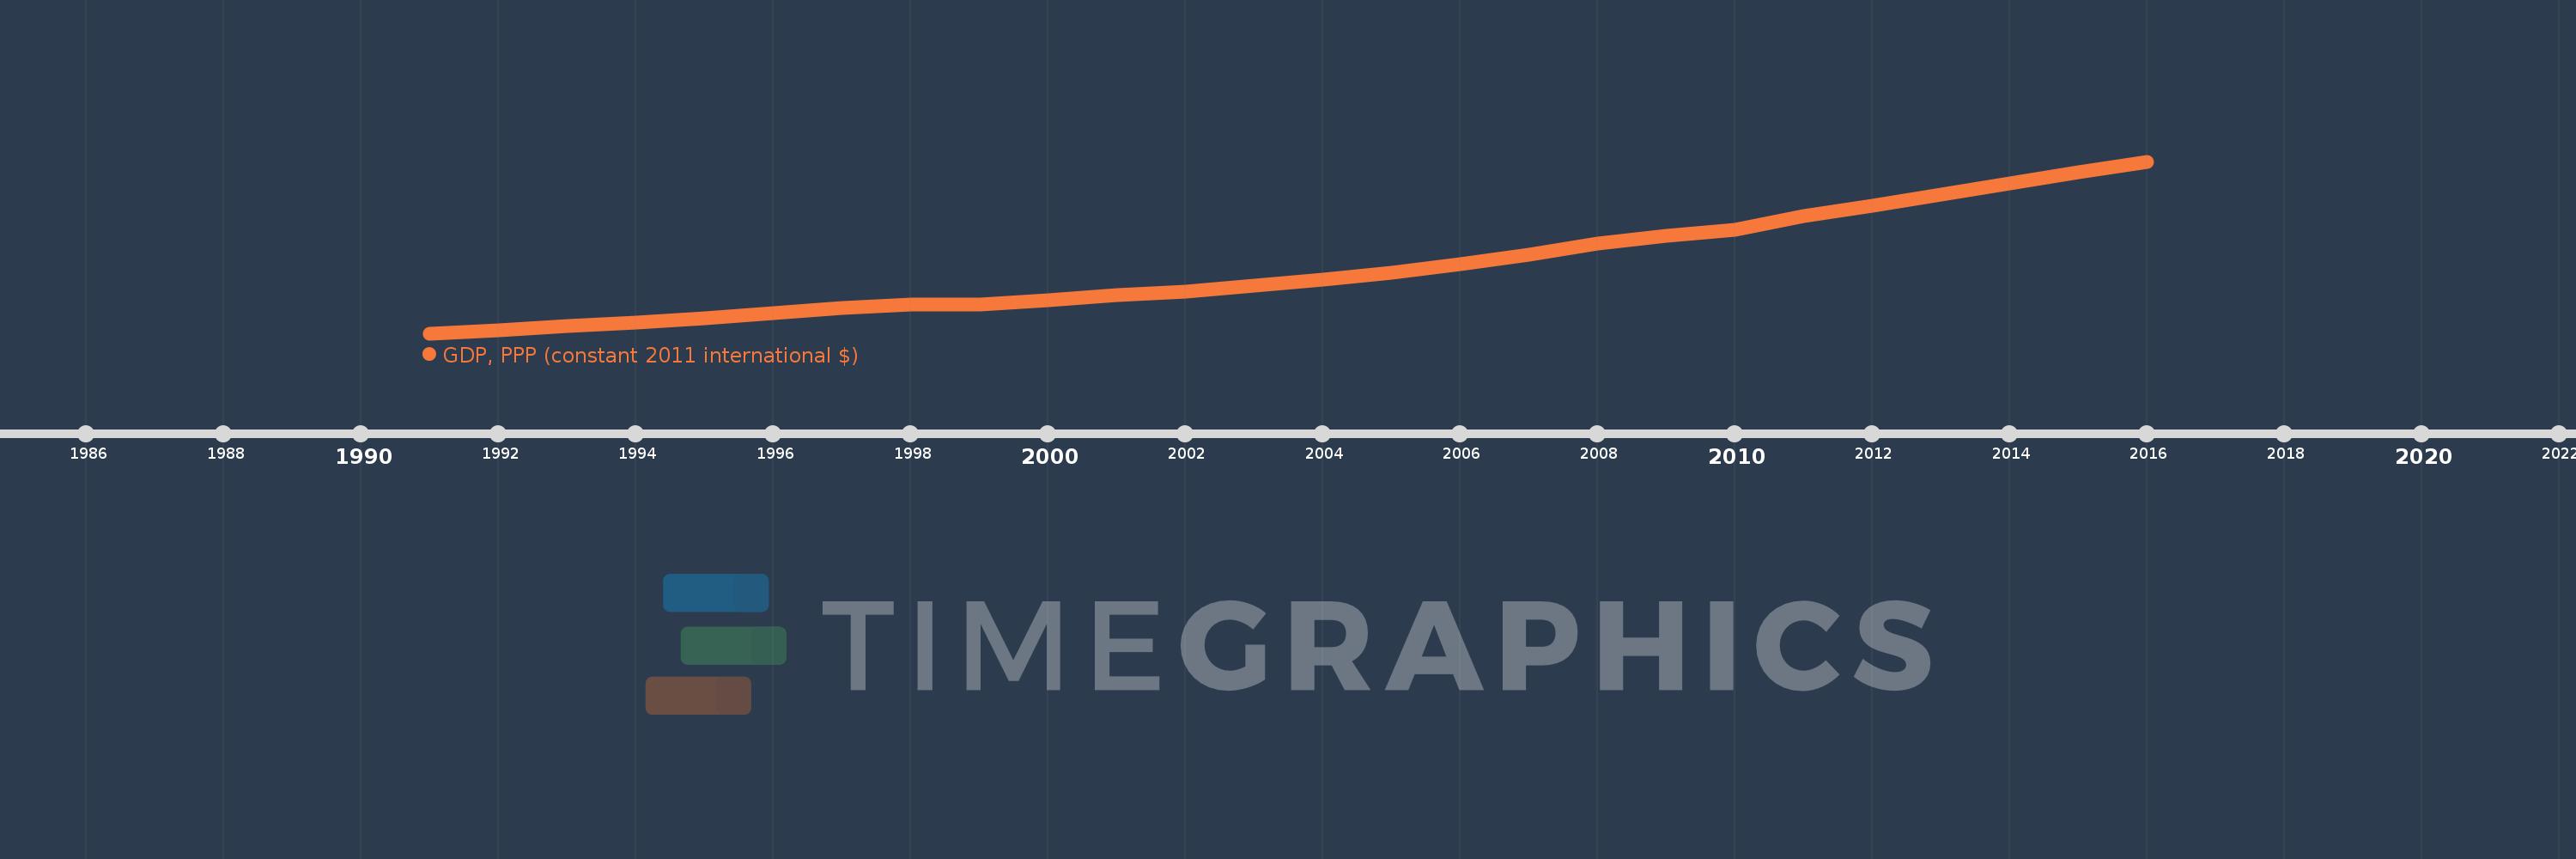
GDP, PPP (constant 2011 international $)
2016,2015,2014,2013,2012,2011,2010,2009,2008,2007,2006,2005,2004,2003,2002,2001,2000,1999,1998,1997,1996,1995,1994,1993,1992,1991
This statistics in other country:
AfghanistanAlbaniaAlgeriaAngolaAntigua and BarbudaArab WorldArgentinaArmeniaArubaAustraliaAustriaAzerbaijanBahamas, TheBahrainBangladeshBarbadosBelarusBelgiumBelizeBeninBermudaBhutanBoliviaBosnia and HerzegovinaBotswanaBrazilBrunei DarussalamBulgariaBurkina FasoBurundiCabo VerdeCambodiaCameroonCanadaCaribbean small statesCayman IslandsCentral African RepublicCentral Europe and the BalticsChadChileChinaColombiaComorosCongo, Dem. Rep.Congo, Rep.Costa RicaCote d'IvoireCroatiaCubaCyprusCzech RepublicDenmarkDjiboutiDominicaDominican RepublicEarly-demographic dividendEast Asia & PacificEast Asia & Pacific (excluding high income)East Asia & Pacific (IDA & IBRD countries)EcuadorEgypt, Arab Rep.El SalvadorEquatorial GuineaEritreaEstoniaEthiopiaEuro areaEurope & Central AsiaEurope & Central Asia (excluding high income)Europe & Central Asia (IDA & IBRD countries)European UnionFijiFinlandFragile and conflict affected situationsFranceGabonGambia, TheGeorgiaGermanyGhanaGreeceGrenadaGuatemalaGuineaGuinea-BissauGuyanaHaitiHeavily indebted poor countries (HIPC)High incomeHondurasHong Kong SAR, ChinaHungaryIBRD onlyIcelandIDA & IBRD totalIDA blendIDA onlyIDA totalIndiaIndonesiaIran, Islamic Rep.IraqIrelandIsraelItalyJamaicaJapanJordanKazakhstanKenyaKiribatiKorea, Rep.KosovoKuwaitKyrgyz RepublicLao PDRLate-demographic dividendLatin America & Caribbean Latin America & Caribbean (excluding high income)Latin America & the Caribbean (IDA & IBRD countries)LatviaLeast developed countries: UN classificationLebanonLesothoLiberiaLibyaLithuaniaLow & middle incomeLow incomeLower middle incomeLuxembourgMacao SAR, ChinaMacedonia, FYRMadagascarMalawiMalaysiaMaldivesMaliMaltaMarshall IslandsMauritaniaMauritiusMexicoMicronesia, Fed. Sts.Middle East & North AfricaMiddle East & North Africa (excluding high income)Middle East & North Africa (IDA & IBRD countries)Middle incomeMoldovaMongoliaMontenegroMoroccoMozambiqueMyanmarNamibiaNauruNepalNetherlandsNew ZealandNicaraguaNigerNigeriaNorth AmericaNorwayOECD membersOmanOther small statesPacific island small statesPakistanPalauPanamaPapua New GuineaParaguayPeruPhilippinesPolandPortugalPost-demographic dividendPre-demographic dividendPuerto RicoQatarRomaniaRussian FederationRwandaSamoaSao Tome and PrincipeSaudi ArabiaSenegalSerbiaSeychellesSierra LeoneSingaporeSint Maarten (Dutch part)Slovak RepublicSloveniaSmall statesSolomon IslandsSouth AfricaSouth AsiaSouth Asia (IDA & IBRD)South SudanSpainSri LankaSt. Kitts and NevisSt. LuciaSt. Vincent and the GrenadinesSub-Saharan Africa Sub-Saharan Africa (excluding high income)Sub-Saharan Africa (IDA & IBRD countries)SudanSurinameSwazilandSwedenSwitzerlandTajikistanTanzaniaThailandTimor-LesteTogoTongaTrinidad and TobagoTunisiaTurkeyTurkmenistanTuvaluUgandaUkraineUnited Arab EmiratesUnited KingdomUnited StatesUpper middle incomeUruguayUzbekistanVanuatuVenezuela, RBVietnamWest Bank and GazaWorldYemen, Rep.ZambiaZimbabwe Timeline:
This timeline shows a graph from 1991 to 2016 of East Asia & Pacific. No data until 1990. Number of actual observations by date: 26.
Source name:
World Development Indicators
Source organization:
World Bank, International Comparison Program database.
Categories, topics:
Economy & Growth
Last updated:
apr 23, 2017
Indicators value changes by year
Minimum:
9.008 trl
jan 1, 1991
Maximum:
34.521 trl
jan 1, 2016
At the date of observation
Value
Absolute change
Change from previous value
jan 1, 1991
9.008 trl
+9.008 trl
0.0%
jan 1, 1992
9.513 trl
+505.816 bln
5.62%
jan 1, 1993
10.03 trl
+516.696 bln
5.43%
jan 1, 1994
10.598 trl
+568.149 bln
5.66%
jan 1, 1995
11.258 trl
+659.88 bln
6.23%
jan 1, 1996
11.995 trl
+736.419 bln
6.54%
jan 1, 1997
12.745 trl
+750.366 bln
6.26%
jan 1, 1998
13.33 trl
+584.771 bln
4.59%
jan 1, 1999
13.321 trl
-8.72 bln
-0.07%
jan 1, 2000
13.875 trl
+553.574 bln
4.16%
jan 1, 2001
14.686 trl
+811.6 bln
5.85%
jan 1, 2002
15.249 trl
+562.621 bln
3.83%
jan 1, 2003
16.026 trl
+776.879 bln
5.09%
jan 1, 2004
16.934 trl
+907.847 bln
5.66%
jan 1, 2005
18.031 trl
+1.097 trl
6.48%
jan 1, 2006
19.22 trl
+1.189 trl
6.6%
jan 1, 2007
20.629 trl
+1.409 trl
7.33%
jan 1, 2008
22.379 trl
+1.75 trl
8.48%
jan 1, 2009
23.539 trl
+1.161 trl
5.19%
jan 1, 2010
24.389 trl
+849.191 bln
3.61%
jan 1, 2011
26.388 trl
+2.0 trl
8.2%
jan 1, 2012
27.998 trl
+1.61 trl
6.1%
jan 1, 2013
29.599 trl
+1.601 trl
5.72%
jan 1, 2014
31.273 trl
+1.675 trl
5.66%
jan 1, 2015
32.889 trl
+1.616 trl
5.17%
jan 1, 2016
34.521 trl
+1.631 trl
4.96%
Ranking of countries by current statistics by years


Comments: