29
/
en
AIzaSyAYiBZKx7MnpbEhh9jyipgxe19OcubqV5w
April 1, 2024
257313
Switzerland
CHE
true
2
1
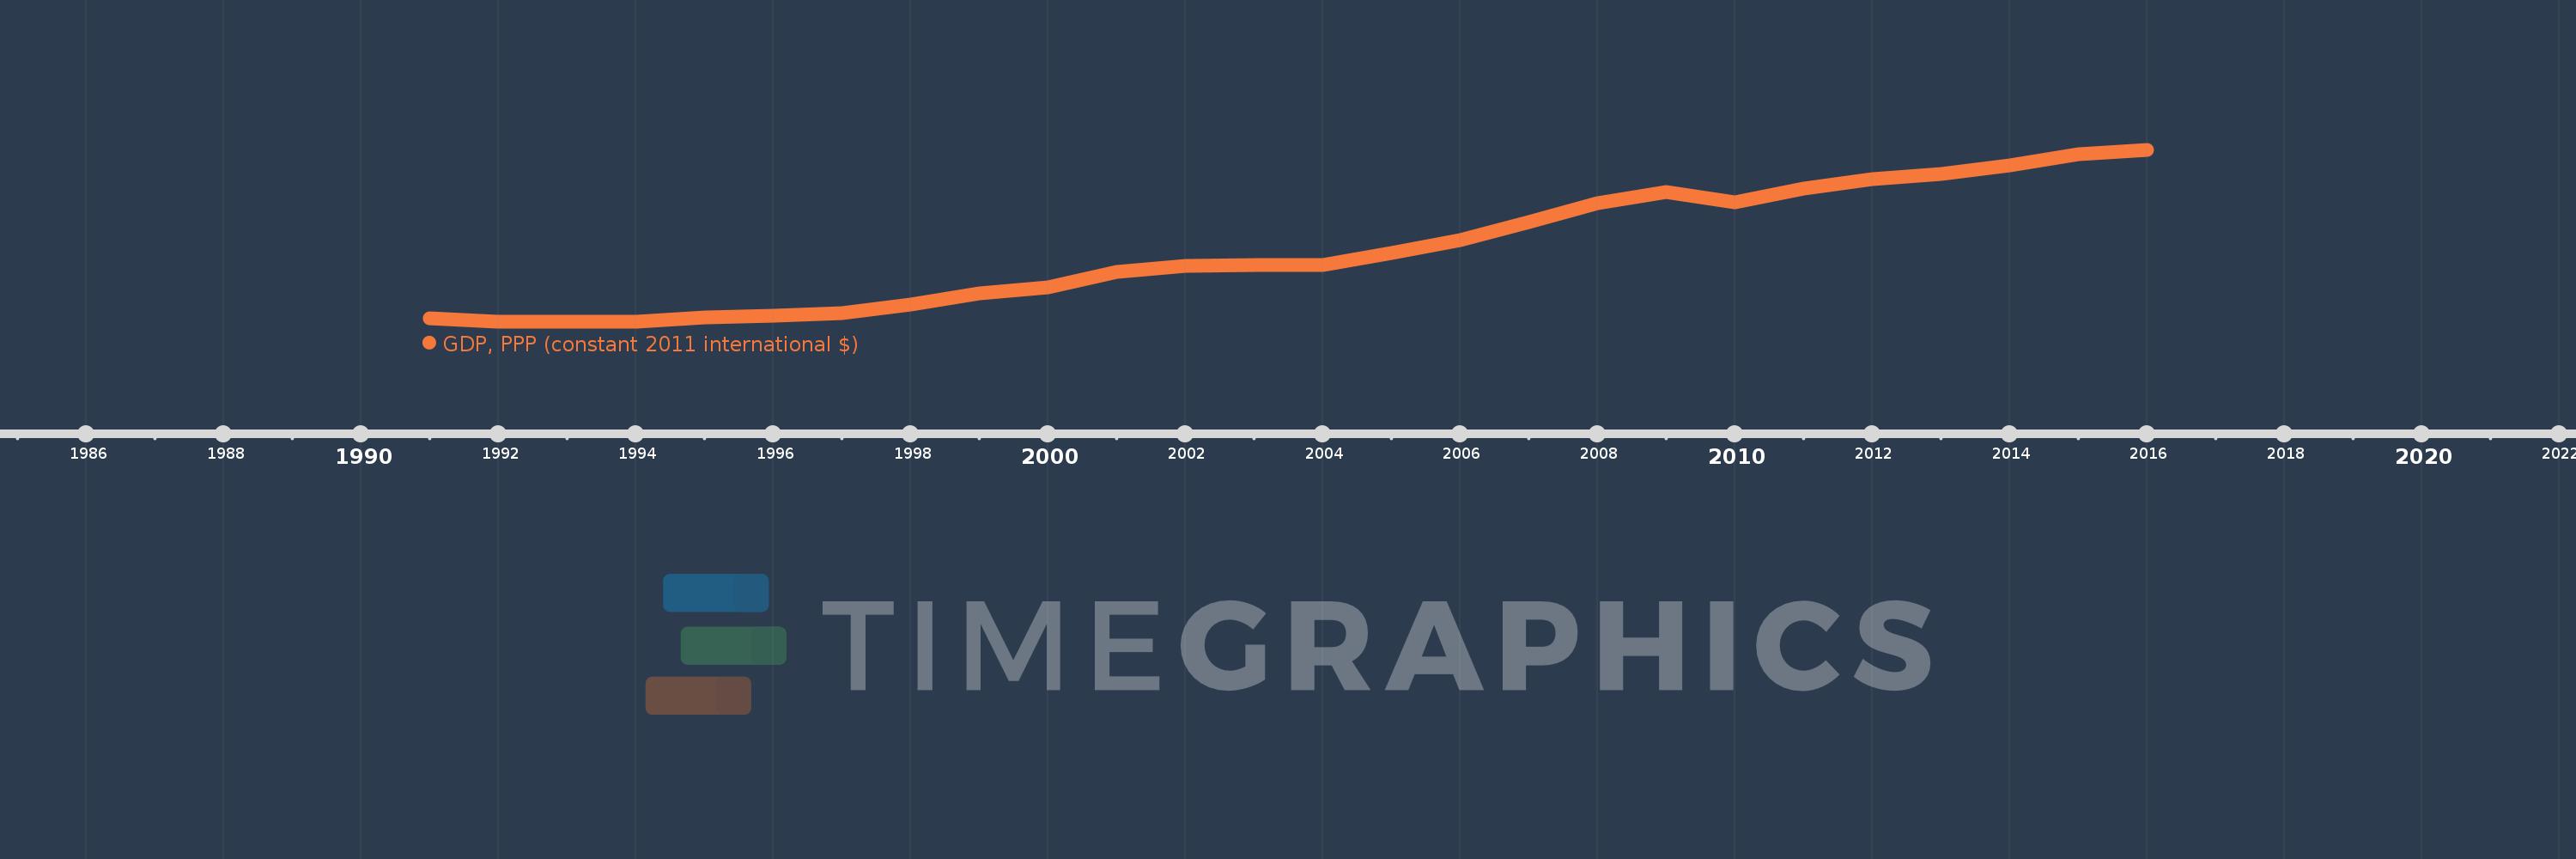
GDP, PPP (constant 2011 international $)
2016,2015,2014,2013,2012,2011,2010,2009,2008,2007,2006,2005,2004,2003,2002,2001,2000,1999,1998,1997,1996,1995,1994,1993,1992,1991
This statistics in other country:
AfghanistanAlbaniaAlgeriaAngolaAntigua and BarbudaArab WorldArgentinaArmeniaArubaAustraliaAustriaAzerbaijanBahamas, TheBahrainBangladeshBarbadosBelarusBelgiumBelizeBeninBermudaBhutanBoliviaBosnia and HerzegovinaBotswanaBrazilBrunei DarussalamBulgariaBurkina FasoBurundiCabo VerdeCambodiaCameroonCanadaCaribbean small statesCayman IslandsCentral African RepublicCentral Europe and the BalticsChadChileChinaColombiaComorosCongo, Dem. Rep.Congo, Rep.Costa RicaCote d'IvoireCroatiaCubaCyprusCzech RepublicDenmarkDjiboutiDominicaDominican RepublicEarly-demographic dividendEast Asia & PacificEast Asia & Pacific (excluding high income)East Asia & Pacific (IDA & IBRD countries)EcuadorEgypt, Arab Rep.El SalvadorEquatorial GuineaEritreaEstoniaEthiopiaEuro areaEurope & Central AsiaEurope & Central Asia (excluding high income)Europe & Central Asia (IDA & IBRD countries)European UnionFijiFinlandFragile and conflict affected situationsFranceGabonGambia, TheGeorgiaGermanyGhanaGreeceGrenadaGuatemalaGuineaGuinea-BissauGuyanaHaitiHeavily indebted poor countries (HIPC)High incomeHondurasHong Kong SAR, ChinaHungaryIBRD onlyIcelandIDA & IBRD totalIDA blendIDA onlyIDA totalIndiaIndonesiaIran, Islamic Rep.IraqIrelandIsraelItalyJamaicaJapanJordanKazakhstanKenyaKiribatiKorea, Rep.KosovoKuwaitKyrgyz RepublicLao PDRLate-demographic dividendLatin America & Caribbean Latin America & Caribbean (excluding high income)Latin America & the Caribbean (IDA & IBRD countries)LatviaLeast developed countries: UN classificationLebanonLesothoLiberiaLibyaLithuaniaLow & middle incomeLow incomeLower middle incomeLuxembourgMacao SAR, ChinaMacedonia, FYRMadagascarMalawiMalaysiaMaldivesMaliMaltaMarshall IslandsMauritaniaMauritiusMexicoMicronesia, Fed. Sts.Middle East & North AfricaMiddle East & North Africa (excluding high income)Middle East & North Africa (IDA & IBRD countries)Middle incomeMoldovaMongoliaMontenegroMoroccoMozambiqueMyanmarNamibiaNauruNepalNetherlandsNew ZealandNicaraguaNigerNigeriaNorth AmericaNorwayOECD membersOmanOther small statesPacific island small statesPakistanPalauPanamaPapua New GuineaParaguayPeruPhilippinesPolandPortugalPost-demographic dividendPre-demographic dividendPuerto RicoQatarRomaniaRussian FederationRwandaSamoaSao Tome and PrincipeSaudi ArabiaSenegalSerbiaSeychellesSierra LeoneSingaporeSint Maarten (Dutch part)Slovak RepublicSloveniaSmall statesSolomon IslandsSouth AfricaSouth AsiaSouth Asia (IDA & IBRD)South SudanSpainSri LankaSt. Kitts and NevisSt. LuciaSt. Vincent and the GrenadinesSub-Saharan Africa Sub-Saharan Africa (excluding high income)Sub-Saharan Africa (IDA & IBRD countries)SudanSurinameSwazilandSwedenSwitzerlandTajikistanTanzaniaThailandTimor-LesteTogoTongaTrinidad and TobagoTunisiaTurkeyTurkmenistanTuvaluUgandaUkraineUnited Arab EmiratesUnited KingdomUnited StatesUpper middle incomeUruguayUzbekistanVanuatuVenezuela, RBVietnamWest Bank and GazaWorldYemen, Rep.ZambiaZimbabwe Timeline:
This timeline shows a graph from 1991 to 2016 of Switzerland. No data until 1990. Number of actual observations by date: 26.
Source name:
World Development Indicators
Source organization:
World Bank, International Comparison Program database.
Categories, topics:
Economy & Growth
Last updated:
apr 23, 2017
Indicators value changes by year
Minimum:
317.312 bln
jan 1, 1994
Maximum:
468.045 bln
jan 1, 2016
At the date of observation
Value
Absolute change
Change from previous value
jan 1, 1991
320.789 bln
+320.789 bln
0.0%
jan 1, 1992
317.851 bln
-2.938 bln
-0.92%
jan 1, 1993
317.712 bln
-139.006 mln
-0.04%
jan 1, 1994
317.312 bln
-400.265 mln
-0.13%
jan 1, 1995
321.341 bln
+4.029 bln
1.27%
jan 1, 1996
322.886 bln
+1.545 bln
0.48%
jan 1, 1997
324.827 bln
+1.941 bln
0.6%
jan 1, 1998
332.337 bln
+7.51 bln
2.31%
jan 1, 1999
342.124 bln
+9.787 bln
2.94%
jan 1, 2000
347.746 bln
+5.622 bln
1.64%
jan 1, 2001
361.469 bln
+13.722 bln
3.95%
jan 1, 2002
366.698 bln
+5.229 bln
1.45%
jan 1, 2003
367.224 bln
+525.824 mln
0.14%
jan 1, 2004
367.406 bln
+182.54 mln
0.05%
jan 1, 2005
377.851 bln
+10.445 bln
2.84%
jan 1, 2006
389.332 bln
+11.48 bln
3.04%
jan 1, 2007
404.955 bln
+15.623 bln
4.01%
jan 1, 2008
421.721 bln
+16.767 bln
4.14%
jan 1, 2009
431.325 bln
+9.604 bln
2.28%
jan 1, 2010
422.139 bln
-9.186 bln
-2.13%
jan 1, 2011
434.609 bln
+12.469 bln
2.95%
jan 1, 2012
442.451 bln
+7.843 bln
1.8%
jan 1, 2013
447.089 bln
+4.637 bln
1.05%
jan 1, 2014
455.049 bln
+7.961 bln
1.78%
jan 1, 2015
464.136 bln
+9.087 bln
2.0%
jan 1, 2016
468.045 bln
+3.909 bln
0.84%
Ranking of countries by current statistics by years


Comments: