29
/
en
AIzaSyAYiBZKx7MnpbEhh9jyipgxe19OcubqV5w
April 1, 2024
59793
Sub-Saharan Africa (excluding high income)
SSA
false
2
1
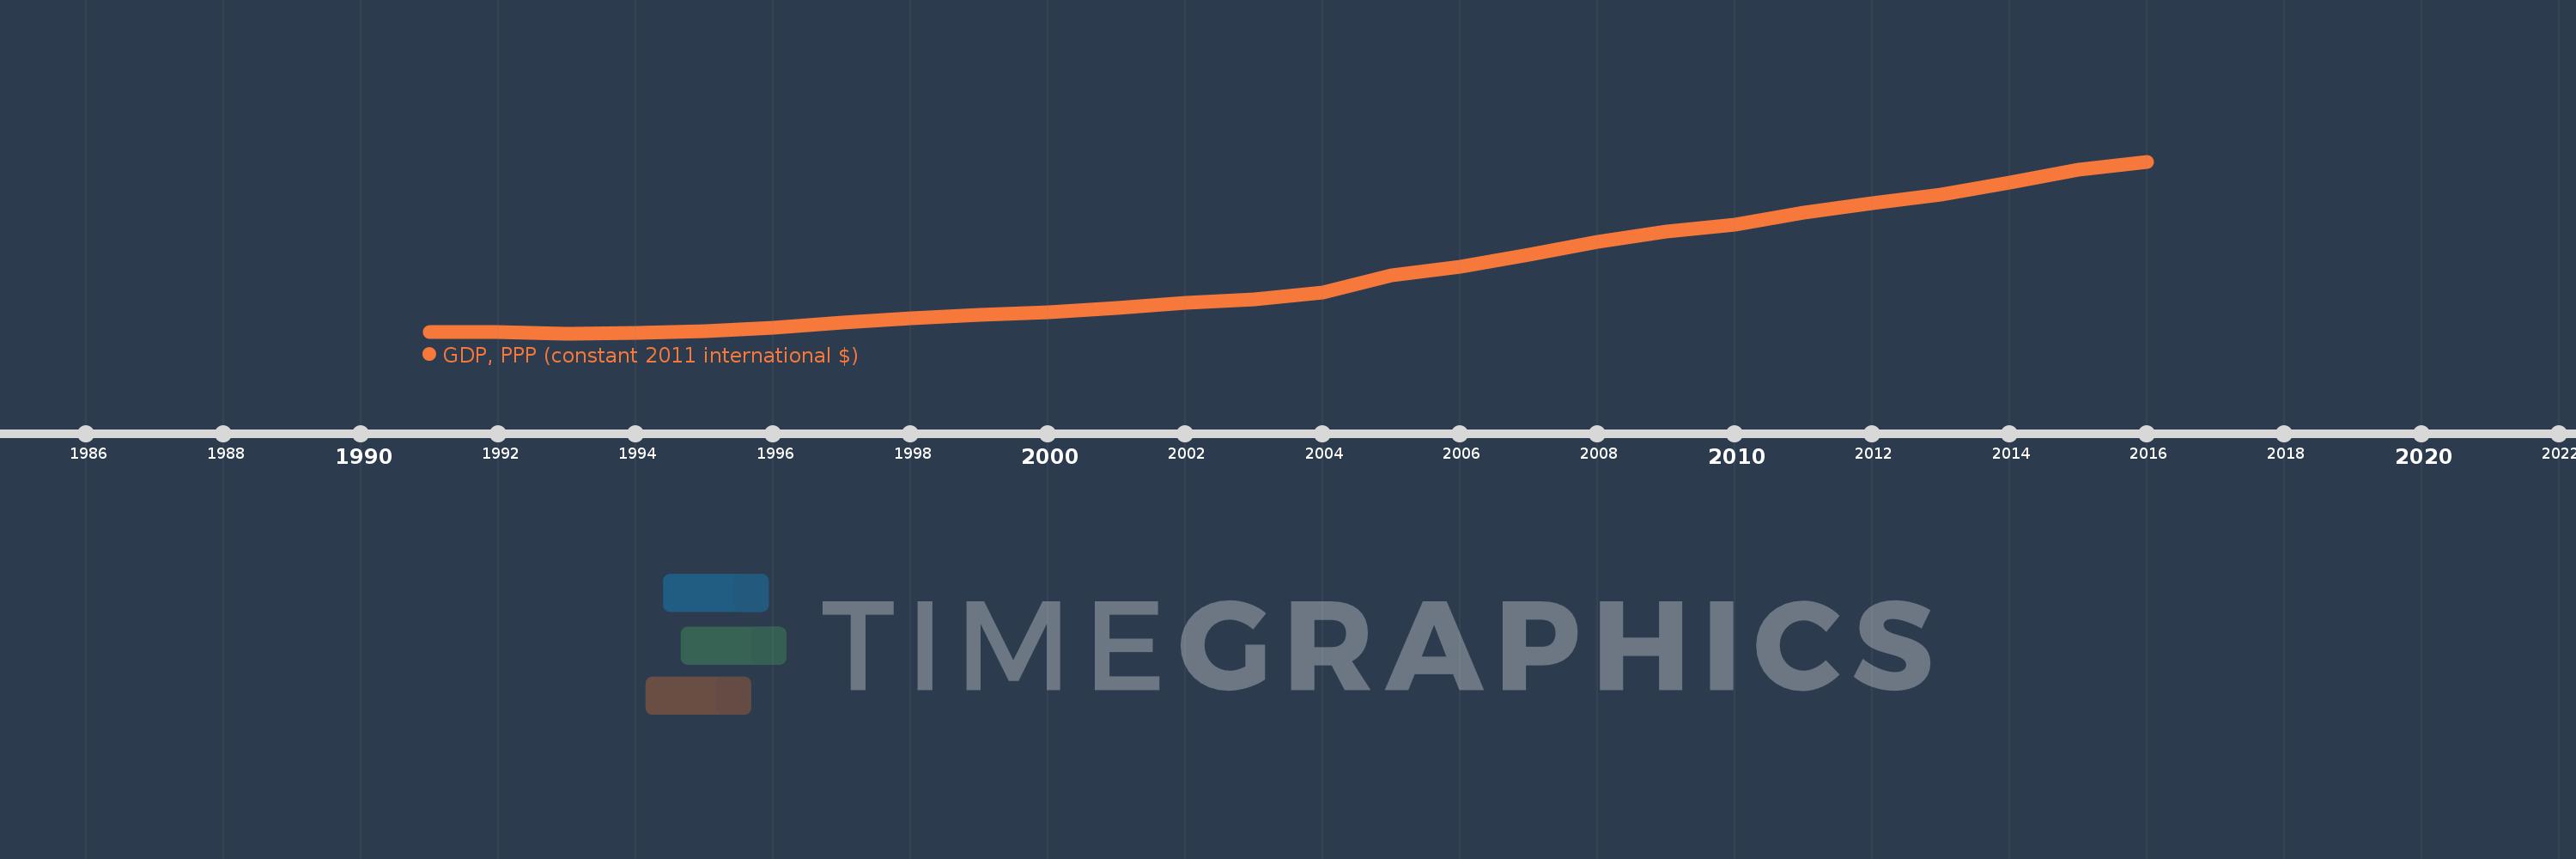
GDP, PPP (constant 2011 international $)
2016,2015,2014,2013,2012,2011,2010,2009,2008,2007,2006,2005,2004,2003,2002,2001,2000,1999,1998,1997,1996,1995,1994,1993,1992,1991
This statistics in other country:
AfghanistanAlbaniaAlgeriaAngolaAntigua and BarbudaArab WorldArgentinaArmeniaArubaAustraliaAustriaAzerbaijanBahamas, TheBahrainBangladeshBarbadosBelarusBelgiumBelizeBeninBermudaBhutanBoliviaBosnia and HerzegovinaBotswanaBrazilBrunei DarussalamBulgariaBurkina FasoBurundiCabo VerdeCambodiaCameroonCanadaCaribbean small statesCayman IslandsCentral African RepublicCentral Europe and the BalticsChadChileChinaColombiaComorosCongo, Dem. Rep.Congo, Rep.Costa RicaCote d'IvoireCroatiaCubaCyprusCzech RepublicDenmarkDjiboutiDominicaDominican RepublicEarly-demographic dividendEast Asia & PacificEast Asia & Pacific (excluding high income)East Asia & Pacific (IDA & IBRD countries)EcuadorEgypt, Arab Rep.El SalvadorEquatorial GuineaEritreaEstoniaEthiopiaEuro areaEurope & Central AsiaEurope & Central Asia (excluding high income)Europe & Central Asia (IDA & IBRD countries)European UnionFijiFinlandFragile and conflict affected situationsFranceGabonGambia, TheGeorgiaGermanyGhanaGreeceGrenadaGuatemalaGuineaGuinea-BissauGuyanaHaitiHeavily indebted poor countries (HIPC)High incomeHondurasHong Kong SAR, ChinaHungaryIBRD onlyIcelandIDA & IBRD totalIDA blendIDA onlyIDA totalIndiaIndonesiaIran, Islamic Rep.IraqIrelandIsraelItalyJamaicaJapanJordanKazakhstanKenyaKiribatiKorea, Rep.KosovoKuwaitKyrgyz RepublicLao PDRLate-demographic dividendLatin America & Caribbean Latin America & Caribbean (excluding high income)Latin America & the Caribbean (IDA & IBRD countries)LatviaLeast developed countries: UN classificationLebanonLesothoLiberiaLibyaLithuaniaLow & middle incomeLow incomeLower middle incomeLuxembourgMacao SAR, ChinaMacedonia, FYRMadagascarMalawiMalaysiaMaldivesMaliMaltaMarshall IslandsMauritaniaMauritiusMexicoMicronesia, Fed. Sts.Middle East & North AfricaMiddle East & North Africa (excluding high income)Middle East & North Africa (IDA & IBRD countries)Middle incomeMoldovaMongoliaMontenegroMoroccoMozambiqueMyanmarNamibiaNauruNepalNetherlandsNew ZealandNicaraguaNigerNigeriaNorth AmericaNorwayOECD membersOmanOther small statesPacific island small statesPakistanPalauPanamaPapua New GuineaParaguayPeruPhilippinesPolandPortugalPost-demographic dividendPre-demographic dividendPuerto RicoQatarRomaniaRussian FederationRwandaSamoaSao Tome and PrincipeSaudi ArabiaSenegalSerbiaSeychellesSierra LeoneSingaporeSint Maarten (Dutch part)Slovak RepublicSloveniaSmall statesSolomon IslandsSouth AfricaSouth AsiaSouth Asia (IDA & IBRD)South SudanSpainSri LankaSt. Kitts and NevisSt. LuciaSt. Vincent and the GrenadinesSub-Saharan Africa Sub-Saharan Africa (excluding high income)Sub-Saharan Africa (IDA & IBRD countries)SudanSurinameSwazilandSwedenSwitzerlandTajikistanTanzaniaThailandTimor-LesteTogoTongaTrinidad and TobagoTunisiaTurkeyTurkmenistanTuvaluUgandaUkraineUnited Arab EmiratesUnited KingdomUnited StatesUpper middle incomeUruguayUzbekistanVanuatuVenezuela, RBVietnamWest Bank and GazaWorldYemen, Rep.ZambiaZimbabwe Timeline:
This timeline shows a graph from 1991 to 2016 of Sub-Saharan Africa (excluding high income). No data until 1990. Number of actual observations by date: 26.
Source name:
World Development Indicators
Source organization:
World Bank, International Comparison Program database.
Categories, topics:
Economy & Growth
Last updated:
apr 23, 2017
Indicators value changes by year
Minimum:
1.282 trl
jan 1, 1993
Maximum:
3.489 trl
jan 1, 2016
At the date of observation
Value
Absolute change
Change from previous value
jan 1, 1991
1.296 trl
+1.296 trl
0.0%
jan 1, 1992
1.298 trl
+2.166 bln
0.17%
jan 1, 1993
1.282 trl
-16.34 bln
-1.26%
jan 1, 1994
1.286 trl
+4.19 bln
0.33%
jan 1, 1995
1.309 trl
+22.8 bln
1.77%
jan 1, 1996
1.351 trl
+41.911 bln
3.2%
jan 1, 1997
1.423 trl
+72.27 bln
5.35%
jan 1, 1998
1.475 trl
+52.263 bln
3.67%
jan 1, 1999
1.514 trl
+38.73 bln
2.62%
jan 1, 2000
1.549 trl
+35.023 bln
2.31%
jan 1, 2001
1.605 trl
+56.067 bln
3.62%
jan 1, 2002
1.672 trl
+66.603 bln
4.15%
jan 1, 2003
1.722 trl
+50.144 bln
3.0%
jan 1, 2004
1.81 trl
+87.53 bln
5.08%
jan 1, 2005
2.031 trl
+220.995 bln
12.21%
jan 1, 2006
2.142 trl
+111.842 bln
5.51%
jan 1, 2007
2.294 trl
+151.241 bln
7.06%
jan 1, 2008
2.455 trl
+161.645 bln
7.05%
jan 1, 2009
2.591 trl
+135.388 bln
5.51%
jan 1, 2010
2.676 trl
+85.678 bln
3.31%
jan 1, 2011
2.829 trl
+152.19 bln
5.69%
jan 1, 2012
2.956 trl
+127.134 bln
4.49%
jan 1, 2013
3.068 trl
+112.596 bln
3.81%
jan 1, 2014
3.222 trl
+153.934 bln
5.02%
jan 1, 2015
3.38 trl
+157.406 bln
4.89%
jan 1, 2016
3.489 trl
+109.916 bln
3.25%
Ranking of countries by current statistics by years


Comments: