29
/
en
AIzaSyAYiBZKx7MnpbEhh9jyipgxe19OcubqV5w
April 1, 2024
285905
Zambia
ZMB
true
2
1
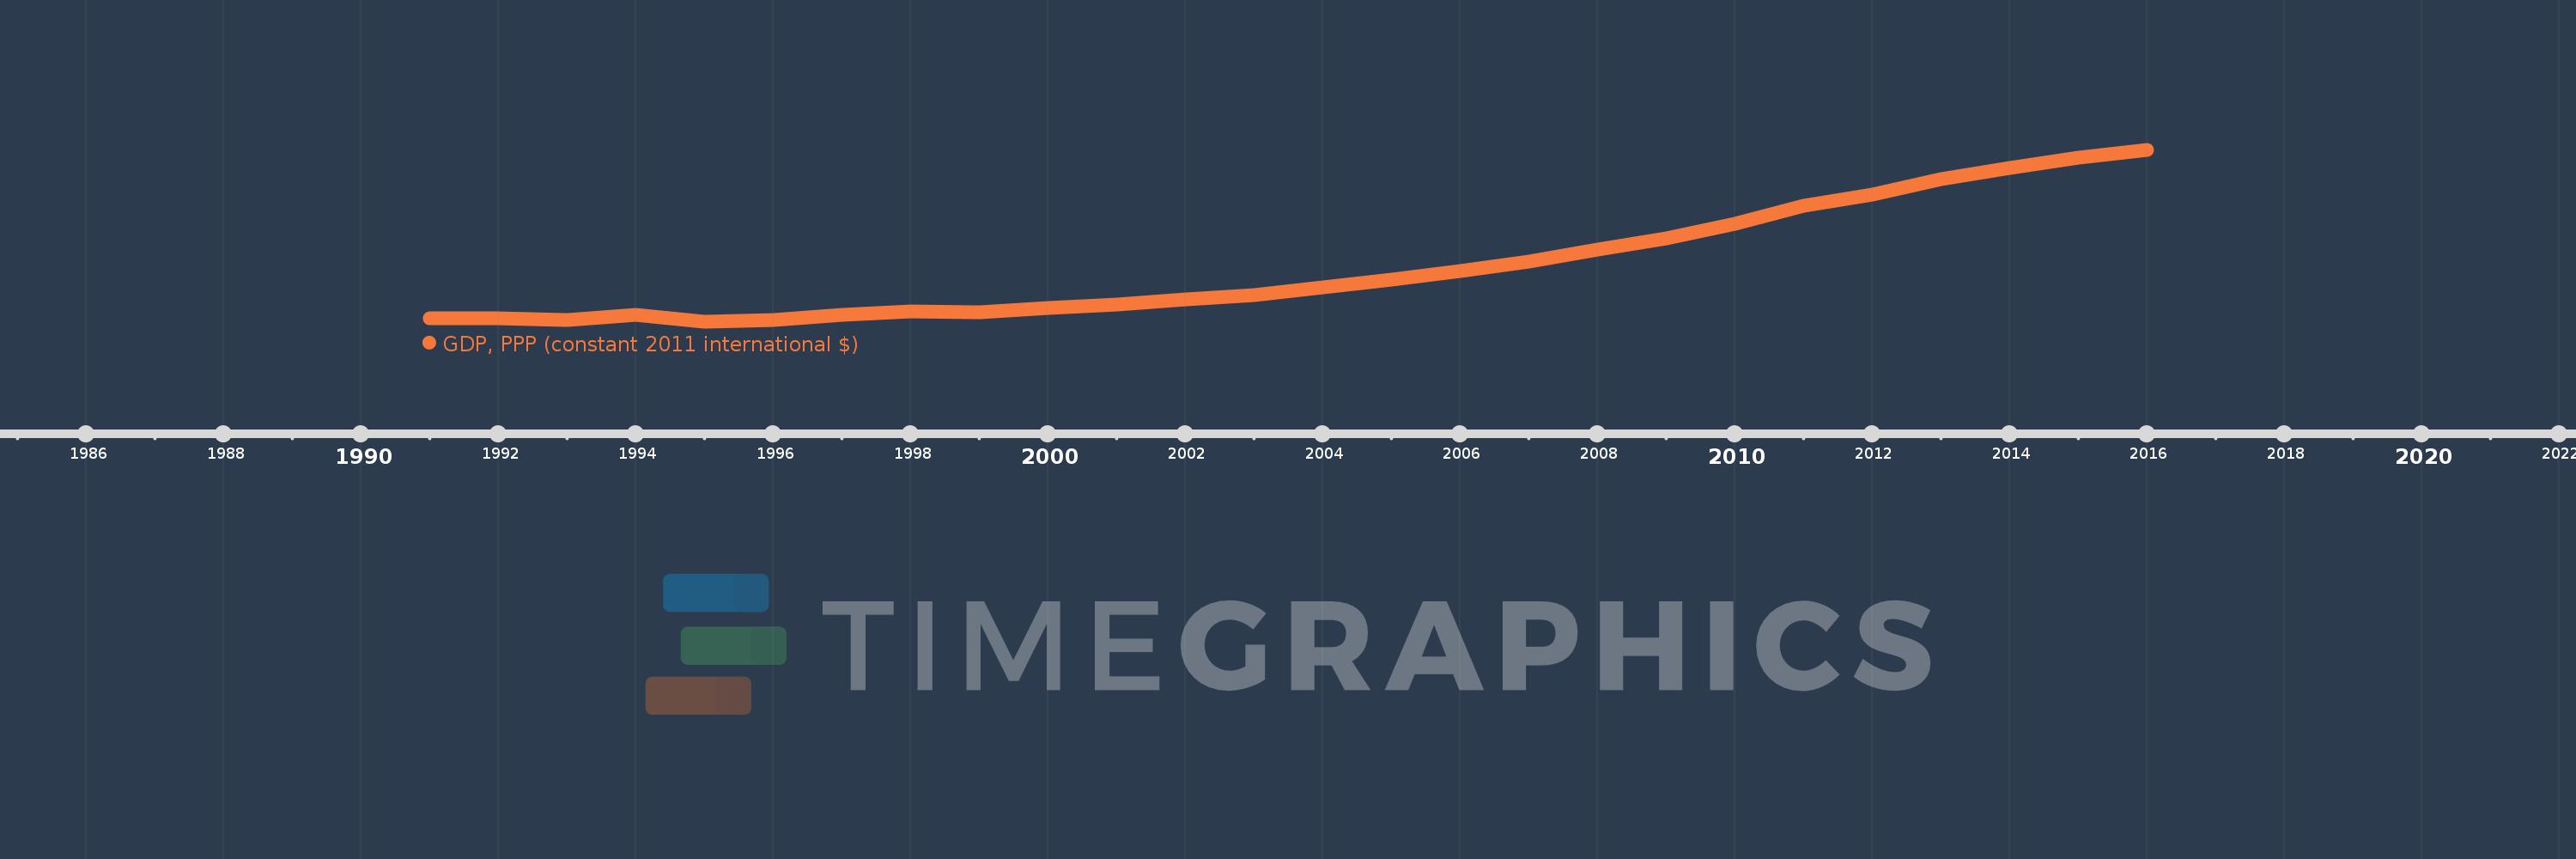
GDP, PPP (constant 2011 international $)
2016,2015,2014,2013,2012,2011,2010,2009,2008,2007,2006,2005,2004,2003,2002,2001,2000,1999,1998,1997,1996,1995,1994,1993,1992,1991
This statistics in other country:
AfghanistanAlbaniaAlgeriaAngolaAntigua and BarbudaArab WorldArgentinaArmeniaArubaAustraliaAustriaAzerbaijanBahamas, TheBahrainBangladeshBarbadosBelarusBelgiumBelizeBeninBermudaBhutanBoliviaBosnia and HerzegovinaBotswanaBrazilBrunei DarussalamBulgariaBurkina FasoBurundiCabo VerdeCambodiaCameroonCanadaCaribbean small statesCayman IslandsCentral African RepublicCentral Europe and the BalticsChadChileChinaColombiaComorosCongo, Dem. Rep.Congo, Rep.Costa RicaCote d'IvoireCroatiaCubaCyprusCzech RepublicDenmarkDjiboutiDominicaDominican RepublicEarly-demographic dividendEast Asia & PacificEast Asia & Pacific (excluding high income)East Asia & Pacific (IDA & IBRD countries)EcuadorEgypt, Arab Rep.El SalvadorEquatorial GuineaEritreaEstoniaEthiopiaEuro areaEurope & Central AsiaEurope & Central Asia (excluding high income)Europe & Central Asia (IDA & IBRD countries)European UnionFijiFinlandFragile and conflict affected situationsFranceGabonGambia, TheGeorgiaGermanyGhanaGreeceGrenadaGuatemalaGuineaGuinea-BissauGuyanaHaitiHeavily indebted poor countries (HIPC)High incomeHondurasHong Kong SAR, ChinaHungaryIBRD onlyIcelandIDA & IBRD totalIDA blendIDA onlyIDA totalIndiaIndonesiaIran, Islamic Rep.IraqIrelandIsraelItalyJamaicaJapanJordanKazakhstanKenyaKiribatiKorea, Rep.KosovoKuwaitKyrgyz RepublicLao PDRLate-demographic dividendLatin America & Caribbean Latin America & Caribbean (excluding high income)Latin America & the Caribbean (IDA & IBRD countries)LatviaLeast developed countries: UN classificationLebanonLesothoLiberiaLibyaLithuaniaLow & middle incomeLow incomeLower middle incomeLuxembourgMacao SAR, ChinaMacedonia, FYRMadagascarMalawiMalaysiaMaldivesMaliMaltaMarshall IslandsMauritaniaMauritiusMexicoMicronesia, Fed. Sts.Middle East & North AfricaMiddle East & North Africa (excluding high income)Middle East & North Africa (IDA & IBRD countries)Middle incomeMoldovaMongoliaMontenegroMoroccoMozambiqueMyanmarNamibiaNauruNepalNetherlandsNew ZealandNicaraguaNigerNigeriaNorth AmericaNorwayOECD membersOmanOther small statesPacific island small statesPakistanPalauPanamaPapua New GuineaParaguayPeruPhilippinesPolandPortugalPost-demographic dividendPre-demographic dividendPuerto RicoQatarRomaniaRussian FederationRwandaSamoaSao Tome and PrincipeSaudi ArabiaSenegalSerbiaSeychellesSierra LeoneSingaporeSint Maarten (Dutch part)Slovak RepublicSloveniaSmall statesSolomon IslandsSouth AfricaSouth AsiaSouth Asia (IDA & IBRD)South SudanSpainSri LankaSt. Kitts and NevisSt. LuciaSt. Vincent and the GrenadinesSub-Saharan Africa Sub-Saharan Africa (excluding high income)Sub-Saharan Africa (IDA & IBRD countries)SudanSurinameSwazilandSwedenSwitzerlandTajikistanTanzaniaThailandTimor-LesteTogoTongaTrinidad and TobagoTunisiaTurkeyTurkmenistanTuvaluUgandaUkraineUnited Arab EmiratesUnited KingdomUnited StatesUpper middle incomeUruguayUzbekistanVanuatuVenezuela, RBVietnamWest Bank and GazaWorldYemen, Rep.ZambiaZimbabwe Timeline:
This timeline shows a graph from 1991 to 2016 of Zambia. No data until 1990. Number of actual observations by date: 26.
Source name:
World Development Indicators
Source organization:
World Bank, International Comparison Program database.
Categories, topics:
Economy & Growth
Last updated:
apr 23, 2017
Indicators value changes by year
Minimum:
18.021 bln
jan 1, 1995
Maximum:
58.4 bln
jan 1, 2016
At the date of observation
Value
Absolute change
Change from previous value
jan 1, 1991
18.799 bln
+18.799 bln
0.0%
jan 1, 1992
18.792 bln
-6.793 mln
-0.04%
jan 1, 1993
18.467 bln
-325.283 mln
-1.73%
jan 1, 1994
19.722 bln
+1.255 bln
6.8%
jan 1, 1995
18.021 bln
-1.701 bln
-8.63%
jan 1, 1996
18.544 bln
+522.198 mln
2.9%
jan 1, 1997
19.697 bln
+1.153 bln
6.22%
jan 1, 1998
20.448 bln
+751.232 mln
3.81%
jan 1, 1999
20.369 bln
-78.877 mln
-0.39%
jan 1, 2000
21.316 bln
+947.198 mln
4.65%
jan 1, 2001
22.147 bln
+830.762 mln
3.9%
jan 1, 2002
23.325 bln
+1.178 bln
5.32%
jan 1, 2003
24.376 bln
+1.051 bln
4.51%
jan 1, 2004
26.068 bln
+1.693 bln
6.94%
jan 1, 2005
27.902 bln
+1.833 bln
7.03%
jan 1, 2006
29.92 bln
+2.019 bln
7.24%
jan 1, 2007
32.285 bln
+2.365 bln
7.9%
jan 1, 2008
34.982 bln
+2.697 bln
8.35%
jan 1, 2009
37.701 bln
+2.719 bln
7.77%
jan 1, 2010
41.178 bln
+3.476 bln
9.22%
jan 1, 2011
45.418 bln
+4.241 bln
10.3%
jan 1, 2012
47.945 bln
+2.527 bln
5.56%
jan 1, 2013
51.588 bln
+3.643 bln
7.6%
jan 1, 2014
54.198 bln
+2.61 bln
5.06%
jan 1, 2015
56.743 bln
+2.545 bln
4.7%
jan 1, 2016
58.4 bln
+1.657 bln
2.92%
Ranking of countries by current statistics by years


Comments: