29
/
en
AIzaSyAYiBZKx7MnpbEhh9jyipgxe19OcubqV5w
April 1, 2024
109677
Congo, Dem. Rep.
COD
true
2
1
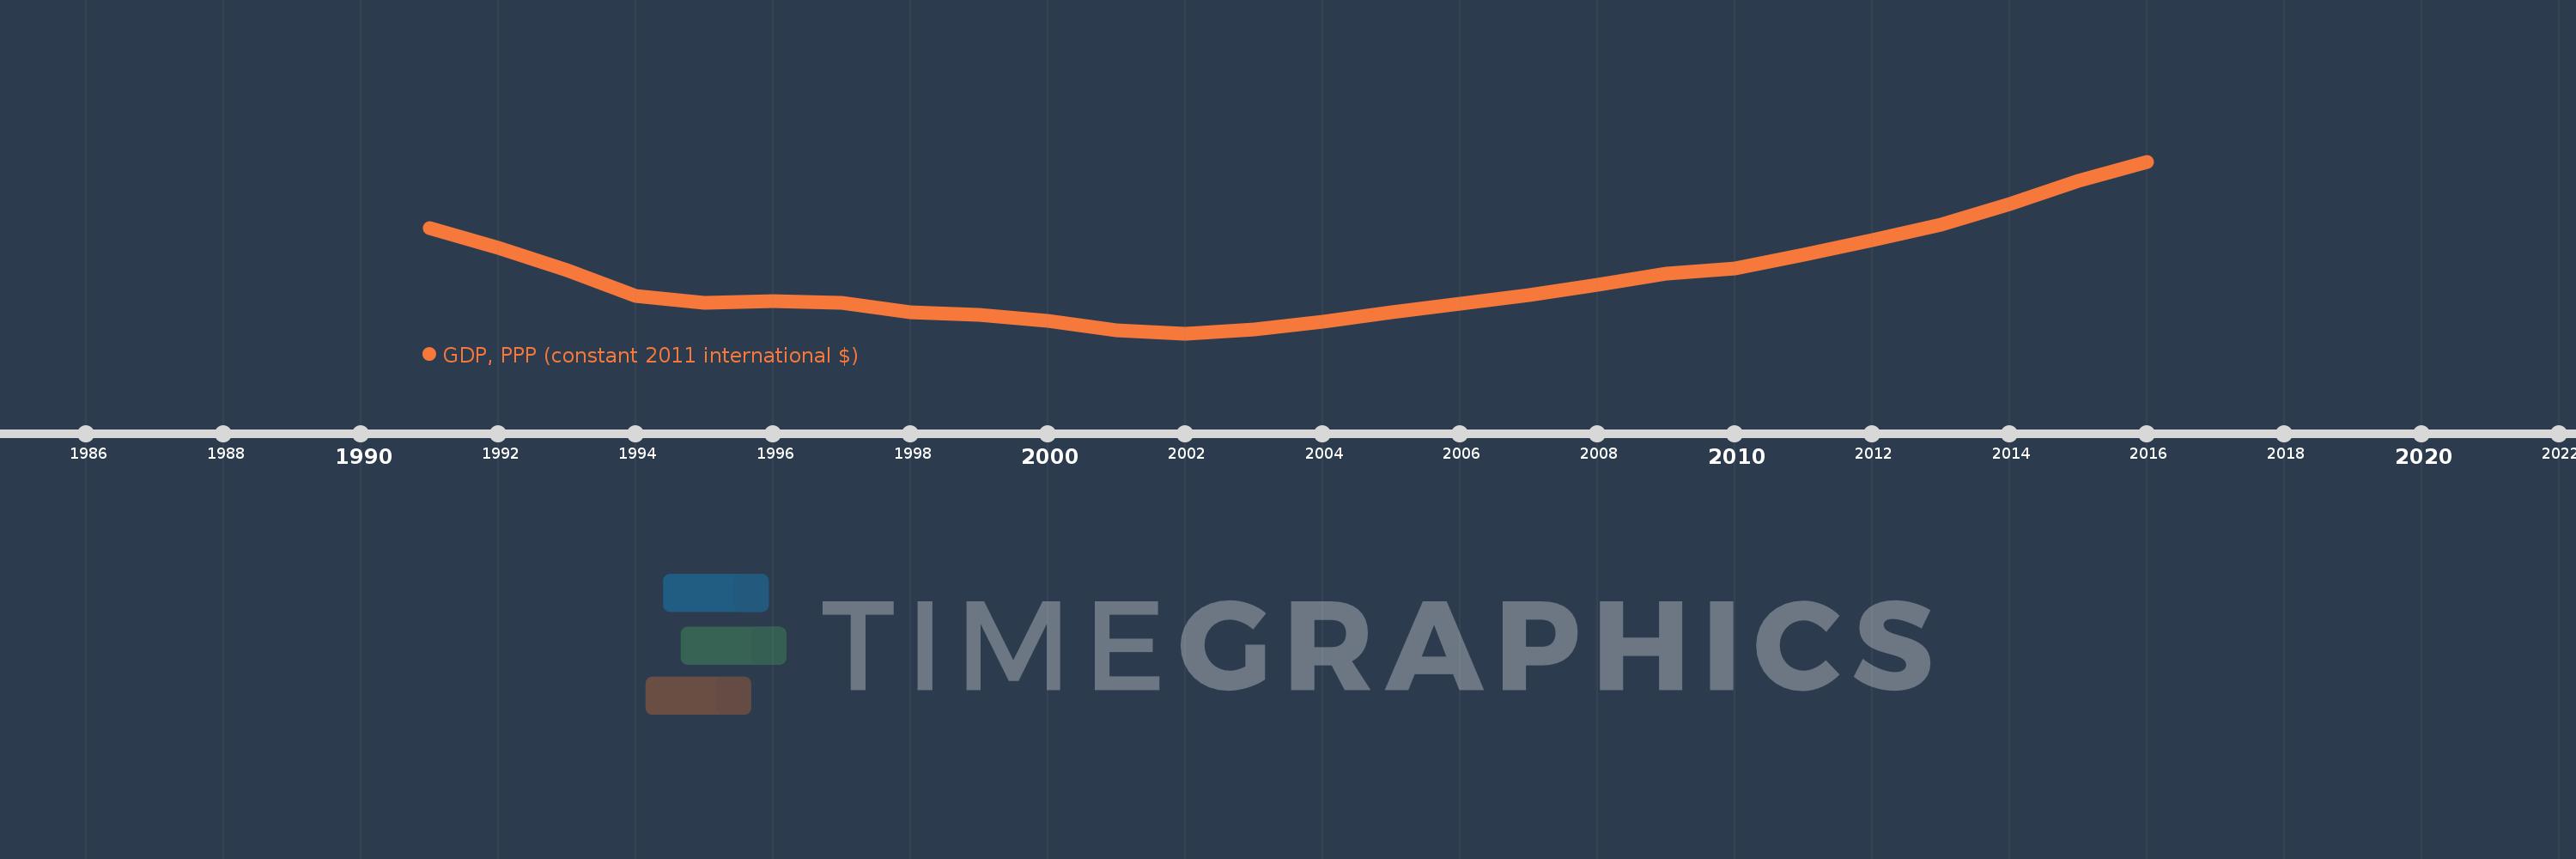
GDP, PPP (constant 2011 international $)
2016,2015,2014,2013,2012,2011,2010,2009,2008,2007,2006,2005,2004,2003,2002,2001,2000,1999,1998,1997,1996,1995,1994,1993,1992,1991
This statistics in other country:
AfghanistanAlbaniaAlgeriaAngolaAntigua and BarbudaArab WorldArgentinaArmeniaArubaAustraliaAustriaAzerbaijanBahamas, TheBahrainBangladeshBarbadosBelarusBelgiumBelizeBeninBermudaBhutanBoliviaBosnia and HerzegovinaBotswanaBrazilBrunei DarussalamBulgariaBurkina FasoBurundiCabo VerdeCambodiaCameroonCanadaCaribbean small statesCayman IslandsCentral African RepublicCentral Europe and the BalticsChadChileChinaColombiaComorosCongo, Dem. Rep.Congo, Rep.Costa RicaCote d'IvoireCroatiaCubaCyprusCzech RepublicDenmarkDjiboutiDominicaDominican RepublicEarly-demographic dividendEast Asia & PacificEast Asia & Pacific (excluding high income)East Asia & Pacific (IDA & IBRD countries)EcuadorEgypt, Arab Rep.El SalvadorEquatorial GuineaEritreaEstoniaEthiopiaEuro areaEurope & Central AsiaEurope & Central Asia (excluding high income)Europe & Central Asia (IDA & IBRD countries)European UnionFijiFinlandFragile and conflict affected situationsFranceGabonGambia, TheGeorgiaGermanyGhanaGreeceGrenadaGuatemalaGuineaGuinea-BissauGuyanaHaitiHeavily indebted poor countries (HIPC)High incomeHondurasHong Kong SAR, ChinaHungaryIBRD onlyIcelandIDA & IBRD totalIDA blendIDA onlyIDA totalIndiaIndonesiaIran, Islamic Rep.IraqIrelandIsraelItalyJamaicaJapanJordanKazakhstanKenyaKiribatiKorea, Rep.KosovoKuwaitKyrgyz RepublicLao PDRLate-demographic dividendLatin America & Caribbean Latin America & Caribbean (excluding high income)Latin America & the Caribbean (IDA & IBRD countries)LatviaLeast developed countries: UN classificationLebanonLesothoLiberiaLibyaLithuaniaLow & middle incomeLow incomeLower middle incomeLuxembourgMacao SAR, ChinaMacedonia, FYRMadagascarMalawiMalaysiaMaldivesMaliMaltaMarshall IslandsMauritaniaMauritiusMexicoMicronesia, Fed. Sts.Middle East & North AfricaMiddle East & North Africa (excluding high income)Middle East & North Africa (IDA & IBRD countries)Middle incomeMoldovaMongoliaMontenegroMoroccoMozambiqueMyanmarNamibiaNauruNepalNetherlandsNew ZealandNicaraguaNigerNigeriaNorth AmericaNorwayOECD membersOmanOther small statesPacific island small statesPakistanPalauPanamaPapua New GuineaParaguayPeruPhilippinesPolandPortugalPost-demographic dividendPre-demographic dividendPuerto RicoQatarRomaniaRussian FederationRwandaSamoaSao Tome and PrincipeSaudi ArabiaSenegalSerbiaSeychellesSierra LeoneSingaporeSint Maarten (Dutch part)Slovak RepublicSloveniaSmall statesSolomon IslandsSouth AfricaSouth AsiaSouth Asia (IDA & IBRD)South SudanSpainSri LankaSt. Kitts and NevisSt. LuciaSt. Vincent and the GrenadinesSub-Saharan Africa Sub-Saharan Africa (excluding high income)Sub-Saharan Africa (IDA & IBRD countries)SudanSurinameSwazilandSwedenSwitzerlandTajikistanTanzaniaThailandTimor-LesteTogoTongaTrinidad and TobagoTunisiaTurkeyTurkmenistanTuvaluUgandaUkraineUnited Arab EmiratesUnited KingdomUnited StatesUpper middle incomeUruguayUzbekistanVanuatuVenezuela, RBVietnamWest Bank and GazaWorldYemen, Rep.ZambiaZimbabwe Timeline:
This timeline shows a graph from 1991 to 2016 of Congo, Dem. Rep.. No data until 1990. Number of actual observations by date: 26.
Source name:
World Development Indicators
Source organization:
World Bank, International Comparison Program database.
Categories, topics:
Economy & Growth
Last updated:
apr 23, 2017
Indicators value changes by year
Minimum:
24.39 bln
jan 1, 2002
Maximum:
56.921 bln
jan 1, 2016
At the date of observation
Value
Absolute change
Change from previous value
jan 1, 1991
44.322 bln
+44.322 bln
0.0%
jan 1, 1992
40.59 bln
-3.732 bln
-8.42%
jan 1, 1993
36.328 bln
-4.262 bln
-10.5%
jan 1, 1994
31.435 bln
-4.893 bln
-13.47%
jan 1, 1995
30.209 bln
-1.226 bln
-3.9%
jan 1, 1996
30.421 bln
+211.463 mln
0.7%
jan 1, 1997
30.109 bln
-311.254 mln
-1.02%
jan 1, 1998
28.418 bln
-1.691 bln
-5.62%
jan 1, 1999
27.956 bln
-461.552 mln
-1.62%
jan 1, 2000
26.763 bln
-1.194 bln
-4.27%
jan 1, 2001
24.913 bln
-1.85 bln
-6.91%
jan 1, 2002
24.39 bln
-523.219 mln
-2.1%
jan 1, 2003
25.109 bln
+718.957 mln
2.95%
jan 1, 2004
26.509 bln
+1.401 bln
5.58%
jan 1, 2005
28.296 bln
+1.786 bln
6.74%
jan 1, 2006
30.032 bln
+1.736 bln
6.14%
jan 1, 2007
31.63 bln
+1.598 bln
5.32%
jan 1, 2008
33.609 bln
+1.98 bln
6.26%
jan 1, 2009
35.702 bln
+2.092 bln
6.23%
jan 1, 2010
36.721 bln
+1.019 bln
2.86%
jan 1, 2011
39.321 bln
+2.599 bln
7.08%
jan 1, 2012
42.02 bln
+2.699 bln
6.86%
jan 1, 2013
45.028 bln
+3.008 bln
7.16%
jan 1, 2014
48.857 bln
+3.829 bln
8.5%
jan 1, 2015
53.239 bln
+4.382 bln
8.97%
jan 1, 2016
56.921 bln
+3.682 bln
6.92%
Ranking of countries by current statistics by years


Comments: