29
/
en
AIzaSyAYiBZKx7MnpbEhh9jyipgxe19OcubqV5w
April 1, 2024
86290
Bhutan
BTN
true
2
1
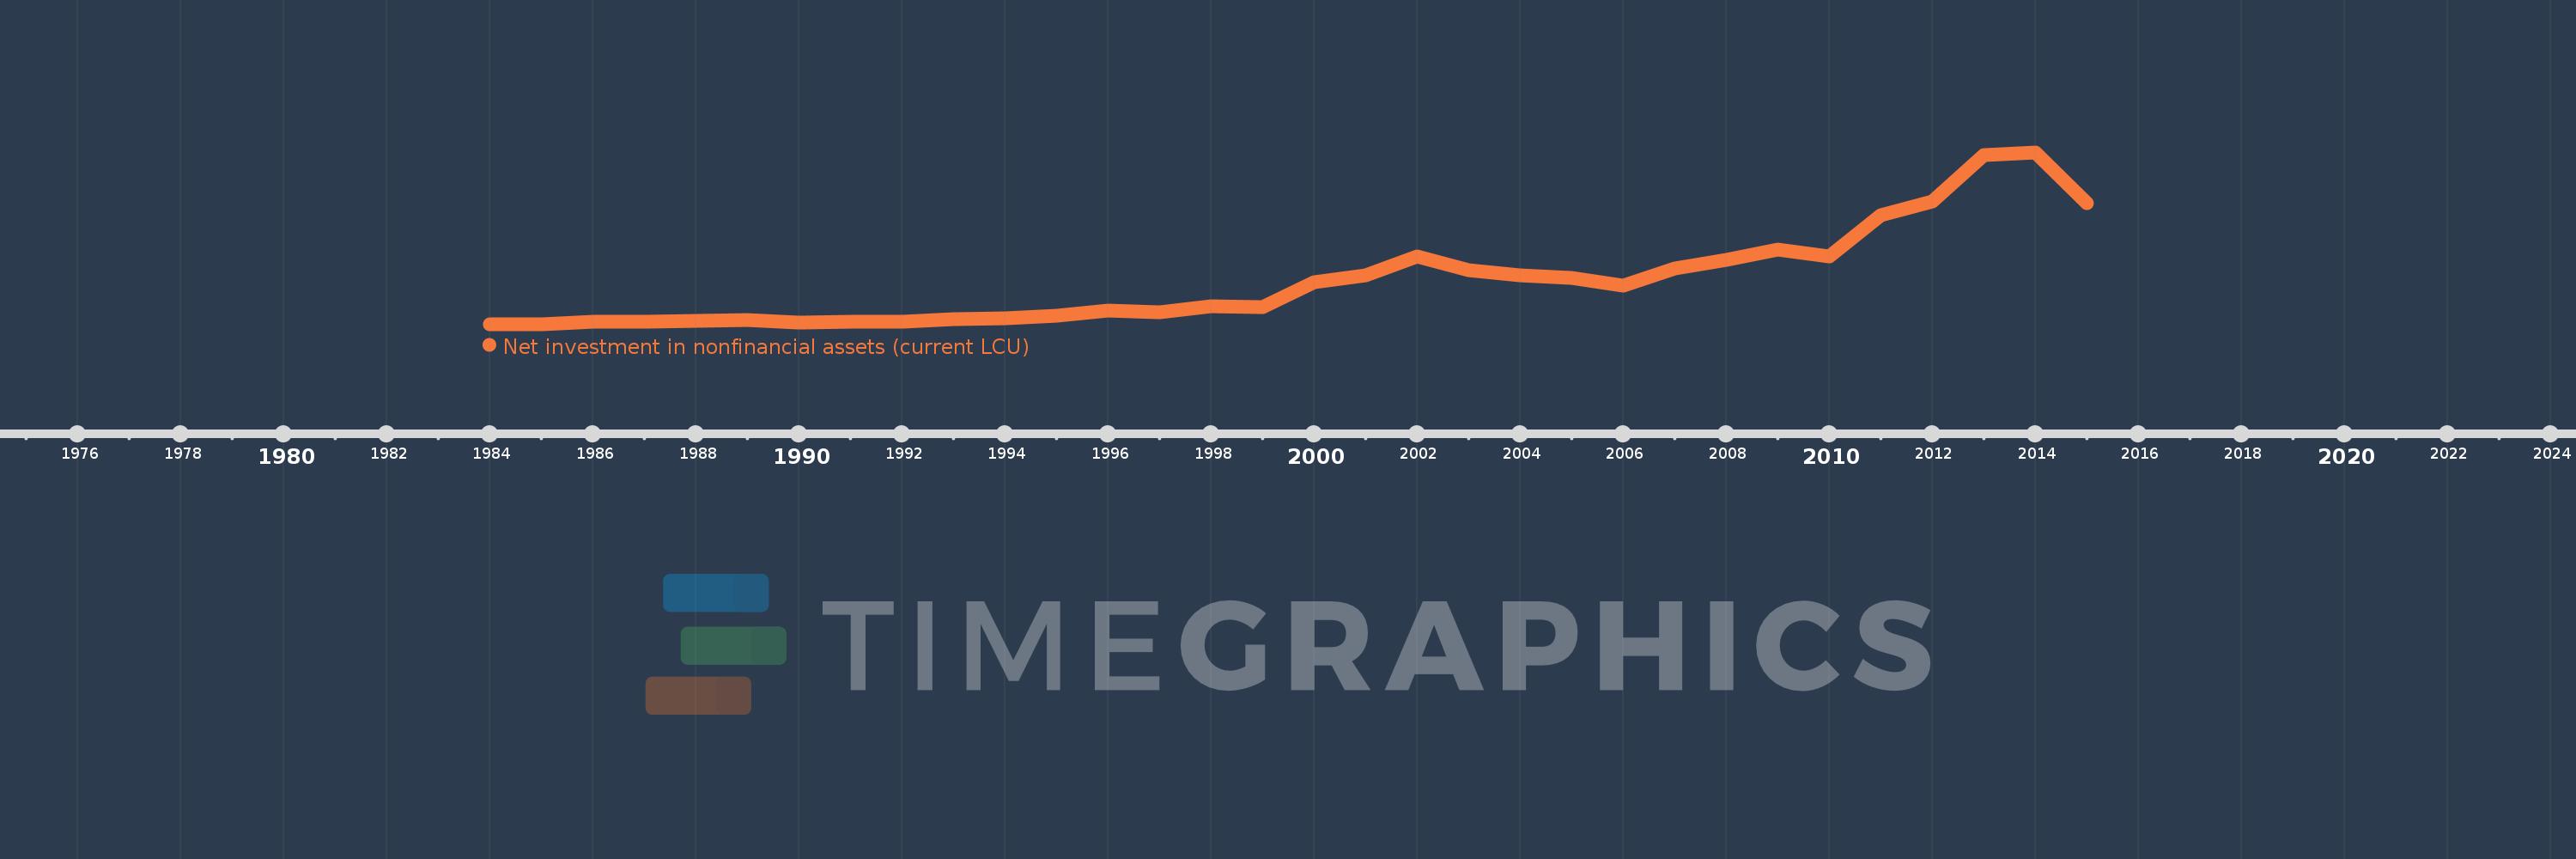
Net investment in nonfinancial assets (current LCU)
2015,2014,2013,2012,2011,2010,2009,2008,2007,2006,2005,2004,2003,2002,2001,2000,1999,1998,1997,1996,1995,1994,1993,1992,1991,1990,1989,1987,1986,1985,1984
This statistics in other country:
AfghanistanAlbaniaAlgeriaAngolaAntigua and BarbudaArmeniaAustraliaAustriaAzerbaijanBahamas, TheBahrainBangladeshBarbadosBelarusBelgiumBelizeBhutanBoliviaBosnia and HerzegovinaBrazilBurundiCabo VerdeCambodiaCanadaCentral African RepublicChileChinaCongo, Dem. Rep.Congo, Rep.Costa RicaCote d'IvoireCroatiaCyprusCzech RepublicDenmarkDominicaDominican RepublicEgypt, Arab Rep.El SalvadorEquatorial GuineaEstoniaEthiopiaFijiFinlandFranceGambia, TheGeorgiaGermanyGreeceGuatemalaHondurasHungaryIcelandIndiaIndonesiaIran, Islamic Rep.IraqIrelandIsraelItalyJamaicaKazakhstanKiribatiKorea, Rep.Kyrgyz RepublicLao PDRLatviaLebanonLithuaniaLuxembourgMacao SAR, ChinaMacedonia, FYRMadagascarMalawiMaldivesMaliMaltaMauritiusMexicoMicronesia, Fed. Sts.MoldovaMongoliaMoroccoMozambiqueNamibiaNepalNetherlandsNew ZealandNicaraguaNigeriaNorwayOmanPakistanParaguayPeruPhilippinesPolandPortugalQatarRomaniaRussian FederationRwandaSamoaSan MarinoSao Tome and PrincipeSenegalSerbiaSierra LeoneSingaporeSlovak RepublicSolomon IslandsSouth AfricaSpainSri LankaSurinameSwazilandSwedenSwitzerlandSyrian Arab RepublicThailandTimor-LesteTrinidad and TobagoTurkeyUgandaUkraineUnited Arab EmiratesUnited KingdomUnited StatesUruguayVanuatuVietnamWest Bank and GazaYemen, Rep.Zimbabwe Timeline:
This timeline shows a graph from 1984 to 2015 of Bhutan. No data until 1983. Number of actual observations by date: 31.
Source name:
World Development Indicators
Source organization:
International Monetary Fund, Government Finance Statistics Yearbook and data files.
Categories, topics:
Public Sector
Last updated:
apr 23, 2017
Indicators value changes by year
Minimum:
442.6 mln
jan 1, 1985
Maximum:
14.741 bln
jan 1, 2014
At the date of observation
Value
Absolute change
Change from previous value
jan 1, 1984
466.2 mln
+466.2 mln
0.0%
jan 1, 1985
442.6 mln
-23.6 mln
-5.06%
jan 1, 1986
652.9 mln
+210.3 mln
47.51%
jan 1, 1987
635.2 mln
-17.7 mln
-2.71%
jan 1, 1989
773.5 mln
+138.3 mln
21.77%
jan 1, 1990
610.9 mln
-162.6 mln
-21.02%
jan 1, 1991
642.8 mln
+31.9 mln
5.22%
jan 1, 1992
614.7 mln
-28.1 mln
-4.37%
jan 1, 1993
857.5 mln
+242.8 mln
39.5%
jan 1, 1994
924.8 mln
+67.3 mln
7.85%
jan 1, 1995
1.134 bln
+208.9 mln
22.59%
jan 1, 1996
1.588 bln
+454.6 mln
40.1%
jan 1, 1997
1.455 bln
-133.1 mln
-8.38%
jan 1, 1998
1.956 bln
+501.2 mln
34.44%
jan 1, 1999
1.844 bln
-112.2 mln
-5.74%
jan 1, 2000
3.933 bln
+2.089 bln
113.27%
jan 1, 2001
4.476 bln
+543.3 mln
13.81%
jan 1, 2002
6.103 bln
+1.627 bln
36.34%
jan 1, 2003
4.919 bln
-1.184 bln
-19.41%
jan 1, 2004
4.492 bln
-426.456 mln
-8.67%
jan 1, 2005
4.319 bln
-172.74 mln
-3.85%
jan 1, 2006
3.661 bln
-658.124 mln
-15.24%
jan 1, 2007
5.067 bln
+1.406 bln
38.4%
jan 1, 2008
5.773 bln
+705.896 mln
13.93%
jan 1, 2009
6.684 bln
+910.837 mln
15.78%
jan 1, 2010
6.061 bln
-623.344 mln
-9.33%
jan 1, 2011
9.542 bln
+3.482 bln
57.45%
jan 1, 2012
10.639 bln
+1.097 bln
11.49%
jan 1, 2013
14.55 bln
+3.911 bln
36.76%
jan 1, 2014
14.741 bln
+190.506 mln
1.31%
jan 1, 2015
10.499 bln
-4.242 bln
-28.78%
Ranking of countries by current statistics by years


Comments: