29
/
en
AIzaSyAYiBZKx7MnpbEhh9jyipgxe19OcubqV5w
April 1, 2024
273978
Ukraine
UKR
true
2
1
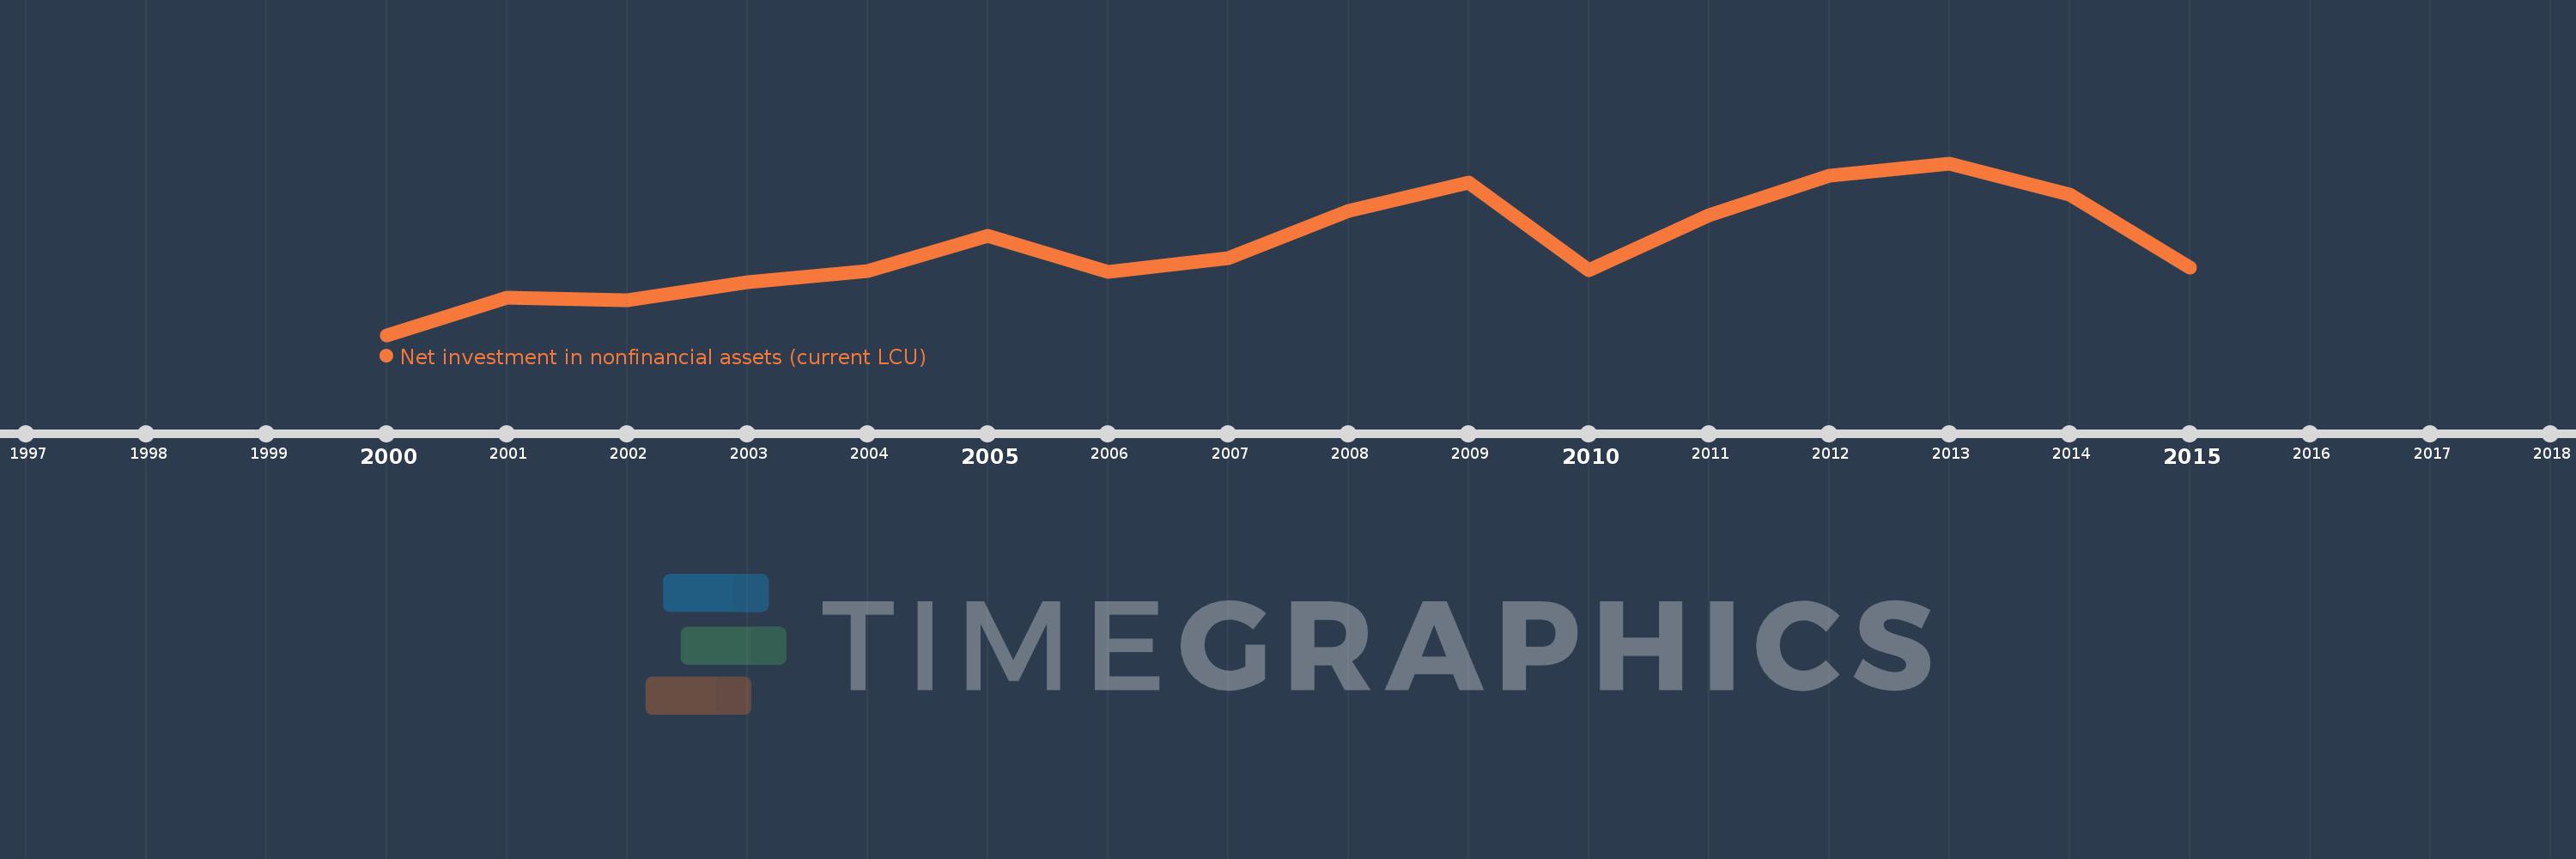
Net investment in nonfinancial assets (current LCU)
2015,2014,2013,2012,2011,2010,2009,2008,2007,2006,2005,2004,2003,2002,2001,2000
This statistics in other country:
AfghanistanAlbaniaAlgeriaAngolaAntigua and BarbudaArmeniaAustraliaAustriaAzerbaijanBahamas, TheBahrainBangladeshBarbadosBelarusBelgiumBelizeBhutanBoliviaBosnia and HerzegovinaBrazilBurundiCabo VerdeCambodiaCanadaCentral African RepublicChileChinaCongo, Dem. Rep.Congo, Rep.Costa RicaCote d'IvoireCroatiaCyprusCzech RepublicDenmarkDominicaDominican RepublicEgypt, Arab Rep.El SalvadorEquatorial GuineaEstoniaEthiopiaFijiFinlandFranceGambia, TheGeorgiaGermanyGreeceGuatemalaHondurasHungaryIcelandIndiaIndonesiaIran, Islamic Rep.IraqIrelandIsraelItalyJamaicaKazakhstanKiribatiKorea, Rep.Kyrgyz RepublicLao PDRLatviaLebanonLithuaniaLuxembourgMacao SAR, ChinaMacedonia, FYRMadagascarMalawiMaldivesMaliMaltaMauritiusMexicoMicronesia, Fed. Sts.MoldovaMongoliaMoroccoMozambiqueNamibiaNepalNetherlandsNew ZealandNicaraguaNigeriaNorwayOmanPakistanParaguayPeruPhilippinesPolandPortugalQatarRomaniaRussian FederationRwandaSamoaSan MarinoSao Tome and PrincipeSenegalSerbiaSierra LeoneSingaporeSlovak RepublicSolomon IslandsSouth AfricaSpainSri LankaSurinameSwazilandSwedenSwitzerlandSyrian Arab RepublicThailandTimor-LesteTrinidad and TobagoTurkeyUgandaUkraineUnited Arab EmiratesUnited KingdomUnited StatesUruguayVanuatuVietnamWest Bank and GazaYemen, Rep.Zimbabwe Timeline:
This timeline shows a graph from 2000 to 2015 of Ukraine. No data until 1999. Number of actual observations by date: 16.
Source name:
World Development Indicators
Source organization:
International Monetary Fund, Government Finance Statistics Yearbook and data files.
Categories, topics:
Public Sector
Last updated:
apr 23, 2017
Indicators value changes by year
Minimum:
639.8 mln
jan 1, 2000
Maximum:
8.491 bln
jan 1, 2013
At the date of observation
Value
Absolute change
Change from previous value
jan 1, 2000
639.8 mln
+639.8 mln
0.0%
jan 1, 2001
2.331 bln
+1.691 bln
264.27%
jan 1, 2002
2.242 bln
-88.6 mln
-3.8%
jan 1, 2003
3.047 bln
+805.158 mln
35.91%
jan 1, 2004
3.549 bln
+501.908 mln
16.47%
jan 1, 2005
5.19 bln
+1.641 bln
46.24%
jan 1, 2006
3.541 bln
-1.649 bln
-31.77%
jan 1, 2007
4.156 bln
+614.7 mln
17.36%
jan 1, 2008
6.33 bln
+2.174 bln
52.31%
jan 1, 2009
7.622 bln
+1.292 bln
20.42%
jan 1, 2010
3.616 bln
-4.005 bln
-52.55%
jan 1, 2011
6.128 bln
+2.512 bln
69.46%
jan 1, 2012
7.914 bln
+1.785 bln
29.13%
jan 1, 2013
8.491 bln
+577.402 mln
7.3%
jan 1, 2014
7.039 bln
-1.452 bln
-17.1%
jan 1, 2015
3.705 bln
-3.334 bln
-47.36%
Ranking of countries by current statistics by years


Comments: