29
/
en
AIzaSyAYiBZKx7MnpbEhh9jyipgxe19OcubqV5w
April 1, 2024
199533
Mongolia
MNG
true
2
1
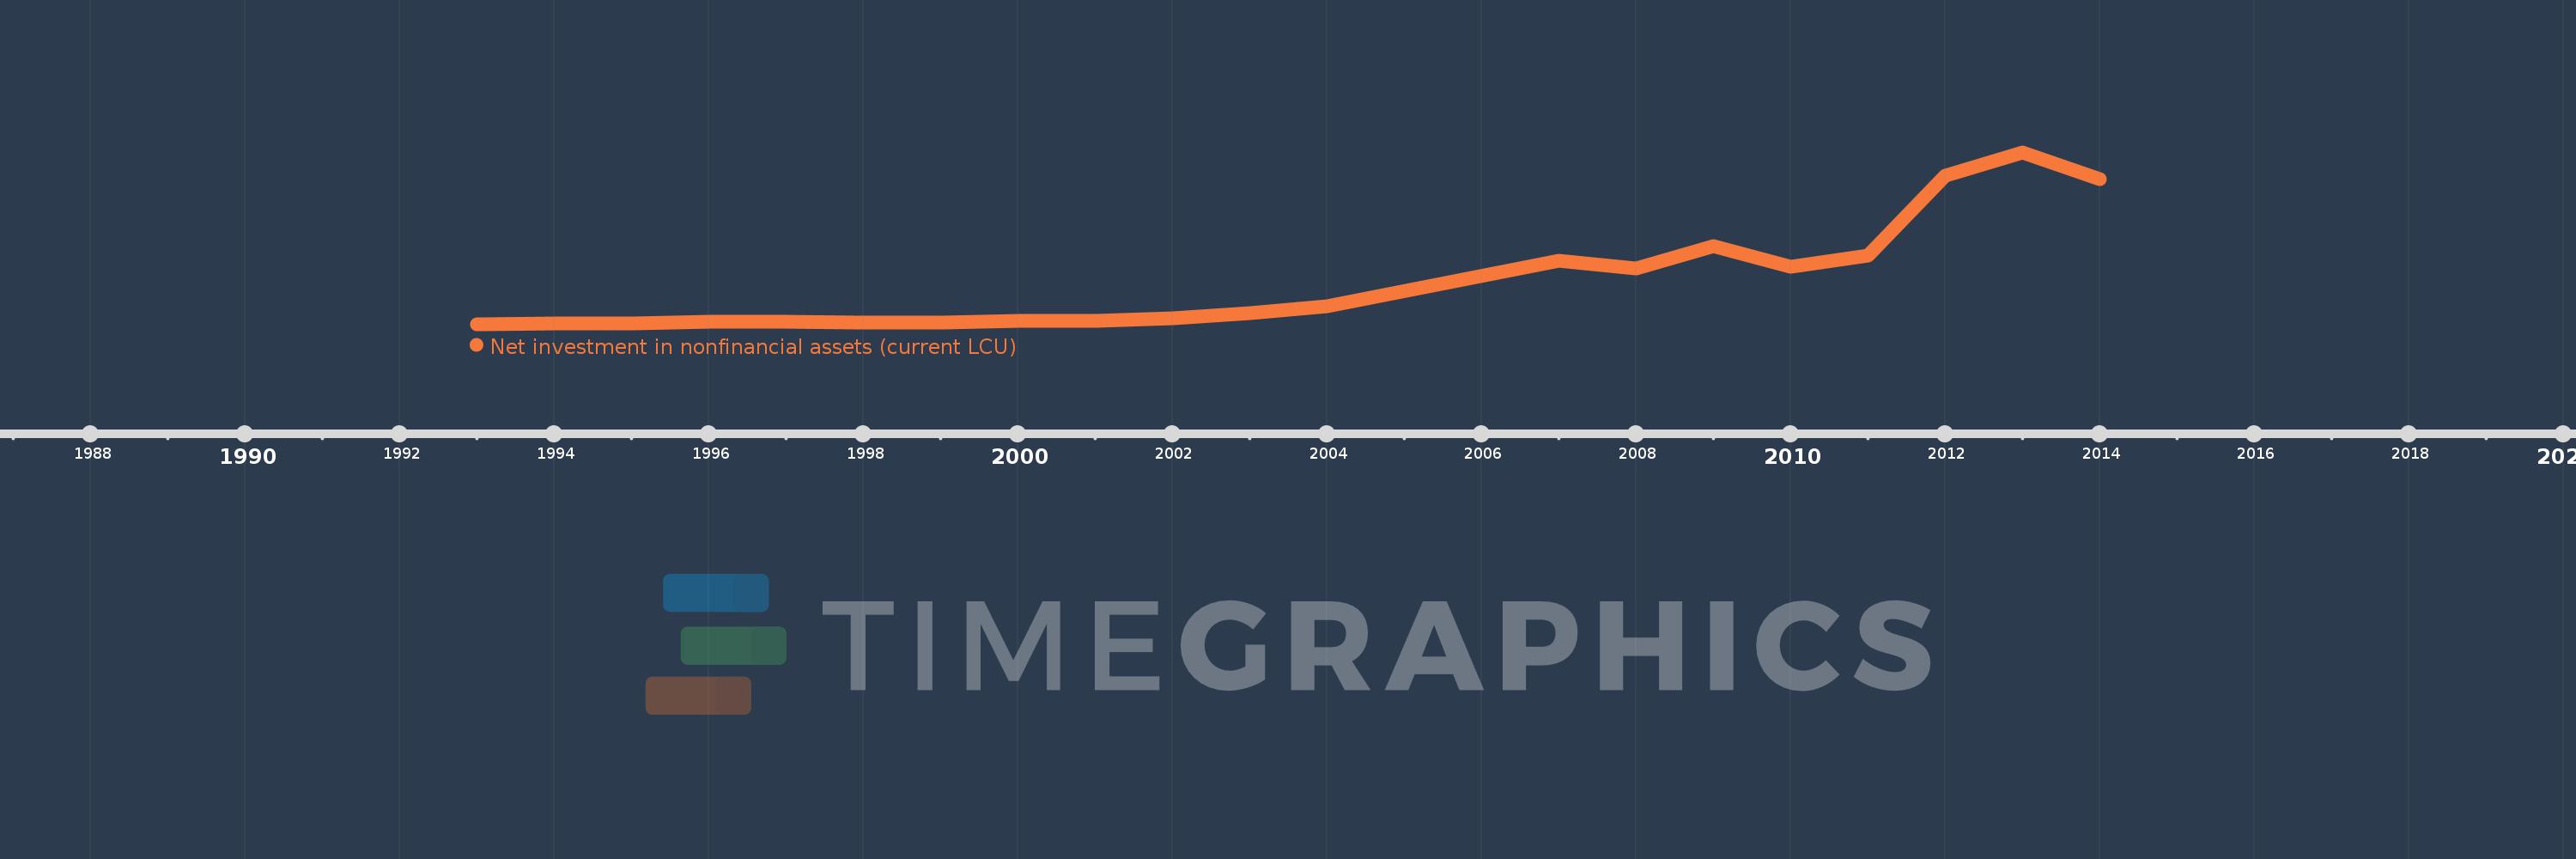
Net investment in nonfinancial assets (current LCU)
2014,2013,2012,2011,2010,2009,2008,2007,2004,2003,2002,2001,2000,1999,1998,1997,1996,1995,1994,1993
This statistics in other country:
AfghanistanAlbaniaAlgeriaAngolaAntigua and BarbudaArmeniaAustraliaAustriaAzerbaijanBahamas, TheBahrainBangladeshBarbadosBelarusBelgiumBelizeBhutanBoliviaBosnia and HerzegovinaBrazilBurundiCabo VerdeCambodiaCanadaCentral African RepublicChileChinaCongo, Dem. Rep.Congo, Rep.Costa RicaCote d'IvoireCroatiaCyprusCzech RepublicDenmarkDominicaDominican RepublicEgypt, Arab Rep.El SalvadorEquatorial GuineaEstoniaEthiopiaFijiFinlandFranceGambia, TheGeorgiaGermanyGreeceGuatemalaHondurasHungaryIcelandIndiaIndonesiaIran, Islamic Rep.IraqIrelandIsraelItalyJamaicaKazakhstanKiribatiKorea, Rep.Kyrgyz RepublicLao PDRLatviaLebanonLithuaniaLuxembourgMacao SAR, ChinaMacedonia, FYRMadagascarMalawiMaldivesMaliMaltaMauritiusMexicoMicronesia, Fed. Sts.MoldovaMongoliaMoroccoMozambiqueNamibiaNepalNetherlandsNew ZealandNicaraguaNigeriaNorwayOmanPakistanParaguayPeruPhilippinesPolandPortugalQatarRomaniaRussian FederationRwandaSamoaSan MarinoSao Tome and PrincipeSenegalSerbiaSierra LeoneSingaporeSlovak RepublicSolomon IslandsSouth AfricaSpainSri LankaSurinameSwazilandSwedenSwitzerlandSyrian Arab RepublicThailandTimor-LesteTrinidad and TobagoTurkeyUgandaUkraineUnited Arab EmiratesUnited KingdomUnited StatesUruguayVanuatuVietnamWest Bank and GazaYemen, Rep.Zimbabwe Timeline:
This timeline shows a graph from 1993 to 2014 of Mongolia. No data until 1992. Number of actual observations by date: 20.
Source name:
World Development Indicators
Source organization:
International Monetary Fund, Government Finance Statistics Yearbook and data files.
Categories, topics:
Public Sector
Last updated:
apr 23, 2017
Indicators value changes by year
Minimum:
830.0 mln
jan 1, 1993
Maximum:
1.279 trl
jan 1, 2013
At the date of observation
Value
Absolute change
Change from previous value
jan 1, 1993
830.0 mln
+830.0 mln
0.0%
jan 1, 1994
8.959 bln
+8.129 bln
979.4%
jan 1, 1995
8.766 bln
-193.0 mln
-2.15%
jan 1, 1996
17.879 bln
+9.113 bln
103.96%
jan 1, 1997
20.407 bln
+2.528 bln
14.14%
jan 1, 1998
13.722 bln
-6.685 bln
-32.76%
jan 1, 1999
15.151 bln
+1.429 bln
10.41%
jan 1, 2000
28.44 bln
+13.289 bln
87.71%
jan 1, 2001
26.909 bln
-1.531 bln
-5.38%
jan 1, 2002
42.251 bln
+15.342 bln
57.01%
jan 1, 2003
86.18 bln
+43.929 bln
103.97%
jan 1, 2004
133.696 bln
+47.516 bln
55.14%
jan 1, 2007
473.145 bln
+339.449 bln
253.9%
jan 1, 2008
413.269 bln
-59.876 bln
-12.65%
jan 1, 2009
582.133 bln
+168.864 bln
40.86%
jan 1, 2010
427.29 bln
-154.842 bln
-26.6%
jan 1, 2011
508.693 bln
+81.403 bln
19.05%
jan 1, 2012
1.104 trl
+595.44 bln
117.05%
jan 1, 2013
1.279 trl
+175.204 bln
15.87%
jan 1, 2014
1.083 trl
-196.267 bln
-15.34%
Ranking of countries by current statistics by years


Comments: