29
/
en
AIzaSyAYiBZKx7MnpbEhh9jyipgxe19OcubqV5w
April 1, 2024
231427
Rwanda
RWA
true
2
1
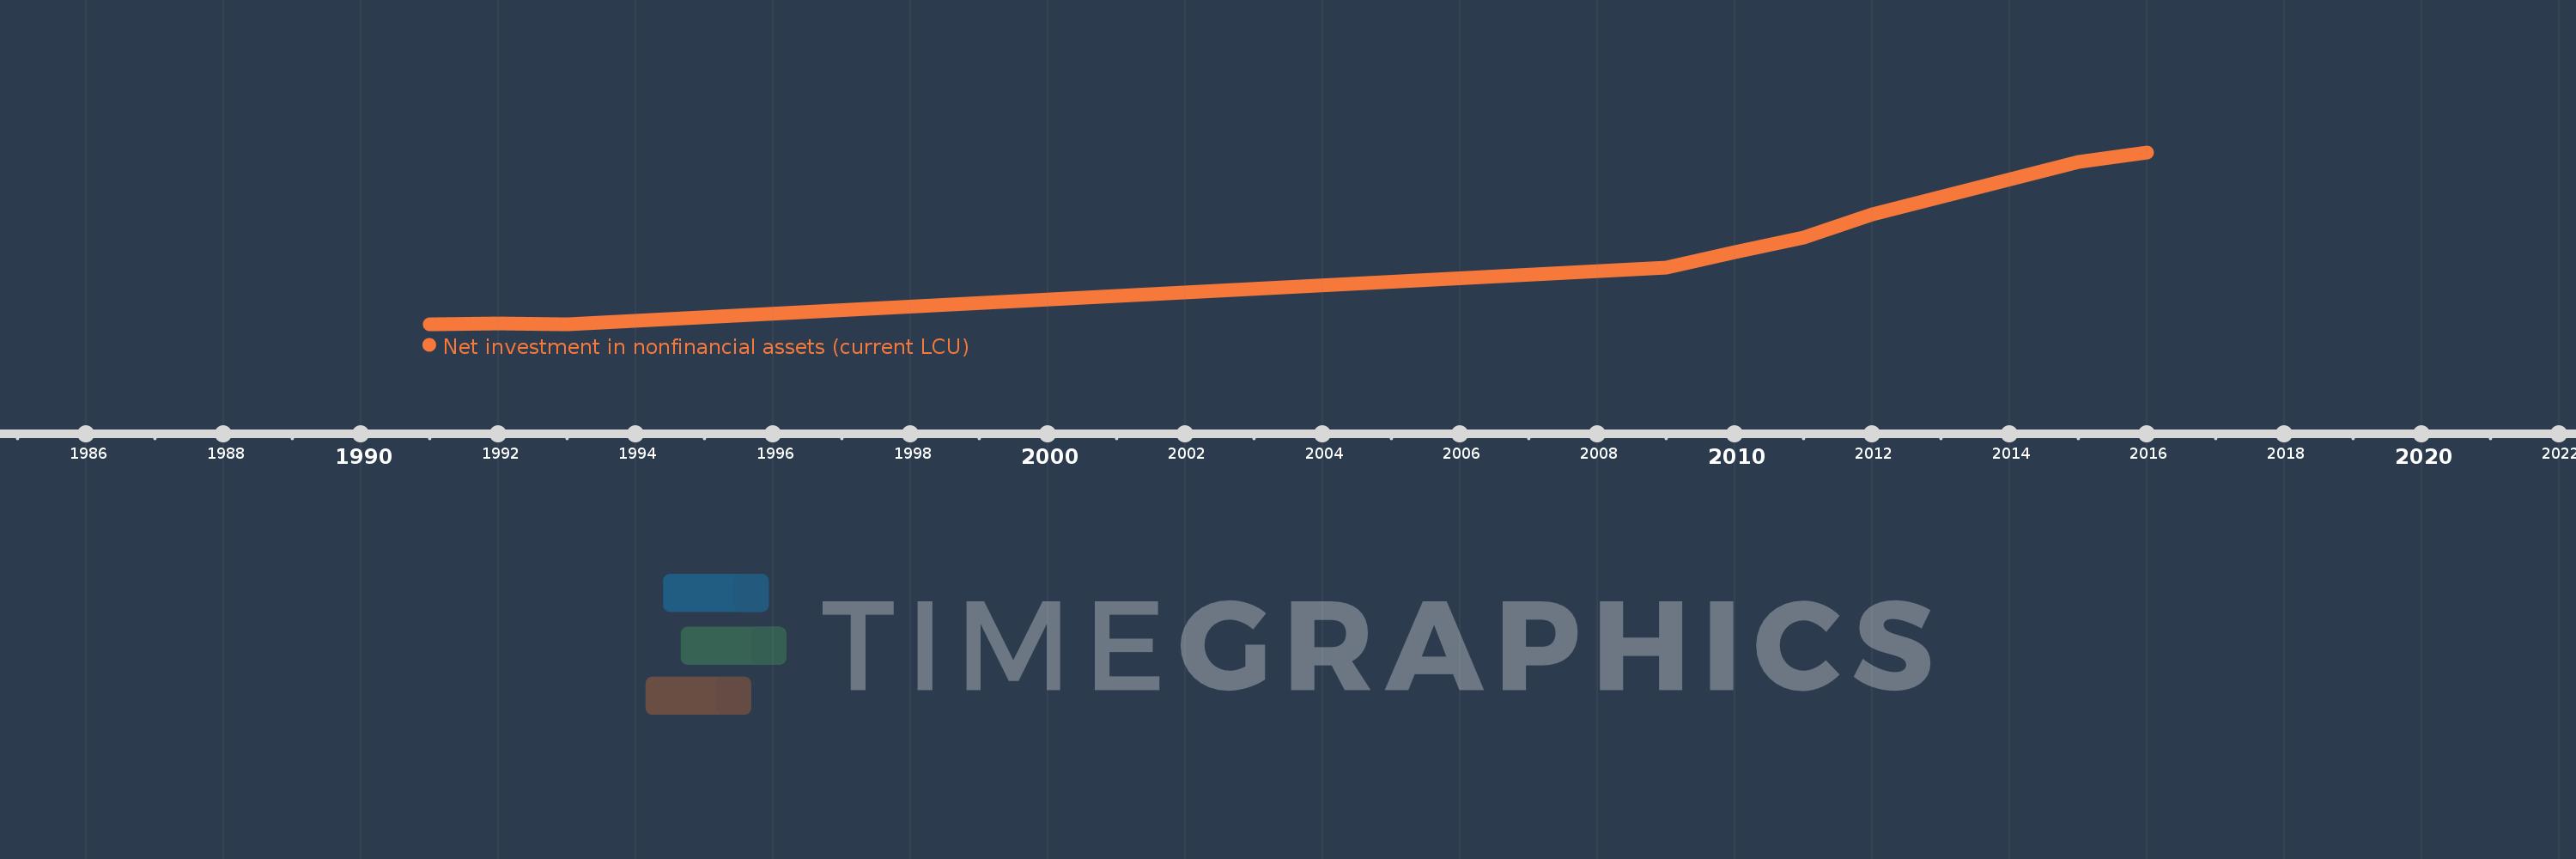
Net investment in nonfinancial assets (current LCU)
2016,2015,2012,2011,2010,2009,1993,1992,1991
This statistics in other country:
AfghanistanAlbaniaAlgeriaAngolaAntigua and BarbudaArmeniaAustraliaAustriaAzerbaijanBahamas, TheBahrainBangladeshBarbadosBelarusBelgiumBelizeBhutanBoliviaBosnia and HerzegovinaBrazilBurundiCabo VerdeCambodiaCanadaCentral African RepublicChileChinaCongo, Dem. Rep.Congo, Rep.Costa RicaCote d'IvoireCroatiaCyprusCzech RepublicDenmarkDominicaDominican RepublicEgypt, Arab Rep.El SalvadorEquatorial GuineaEstoniaEthiopiaFijiFinlandFranceGambia, TheGeorgiaGermanyGreeceGuatemalaHondurasHungaryIcelandIndiaIndonesiaIran, Islamic Rep.IraqIrelandIsraelItalyJamaicaKazakhstanKiribatiKorea, Rep.Kyrgyz RepublicLao PDRLatviaLebanonLithuaniaLuxembourgMacao SAR, ChinaMacedonia, FYRMadagascarMalawiMaldivesMaliMaltaMauritiusMexicoMicronesia, Fed. Sts.MoldovaMongoliaMoroccoMozambiqueNamibiaNepalNetherlandsNew ZealandNicaraguaNigeriaNorwayOmanPakistanParaguayPeruPhilippinesPolandPortugalQatarRomaniaRussian FederationRwandaSamoaSan MarinoSao Tome and PrincipeSenegalSerbiaSierra LeoneSingaporeSlovak RepublicSolomon IslandsSouth AfricaSpainSri LankaSurinameSwazilandSwedenSwitzerlandSyrian Arab RepublicThailandTimor-LesteTrinidad and TobagoTurkeyUgandaUkraineUnited Arab EmiratesUnited KingdomUnited StatesUruguayVanuatuVietnamWest Bank and GazaYemen, Rep.Zimbabwe Timeline:
This timeline shows a graph from 1991 to 2016 of Rwanda. No data until 1990. Number of actual observations by date: 9.
Source name:
World Development Indicators
Source organization:
International Monetary Fund, Government Finance Statistics Yearbook and data files.
Categories, topics:
Public Sector
Last updated:
apr 23, 2017
Indicators value changes by year
Minimum:
13.02 bln
jan 1, 1993
Maximum:
677.114 bln
jan 1, 2016
At the date of observation
Value
Absolute change
Change from previous value
jan 1, 1991
13.199 bln
+13.199 bln
0.0%
jan 1, 1992
17.099 bln
+3.9 bln
29.55%
jan 1, 1993
13.02 bln
-4.079 bln
-23.86%
jan 1, 2009
233.2 bln
+220.18 bln
1.69K%
jan 1, 2010
292.781 bln
+59.581 bln
25.55%
jan 1, 2011
348.731 bln
+55.95 bln
19.11%
jan 1, 2012
439.183 bln
+90.452 bln
25.94%
jan 1, 2015
639.8 bln
+200.617 bln
45.68%
jan 1, 2016
677.114 bln
+37.314 bln
5.83%
Ranking of countries by current statistics by years


Comments: