29
/
en
AIzaSyAYiBZKx7MnpbEhh9jyipgxe19OcubqV5w
April 1, 2024
75394
Azerbaijan
AZE
true
2
1
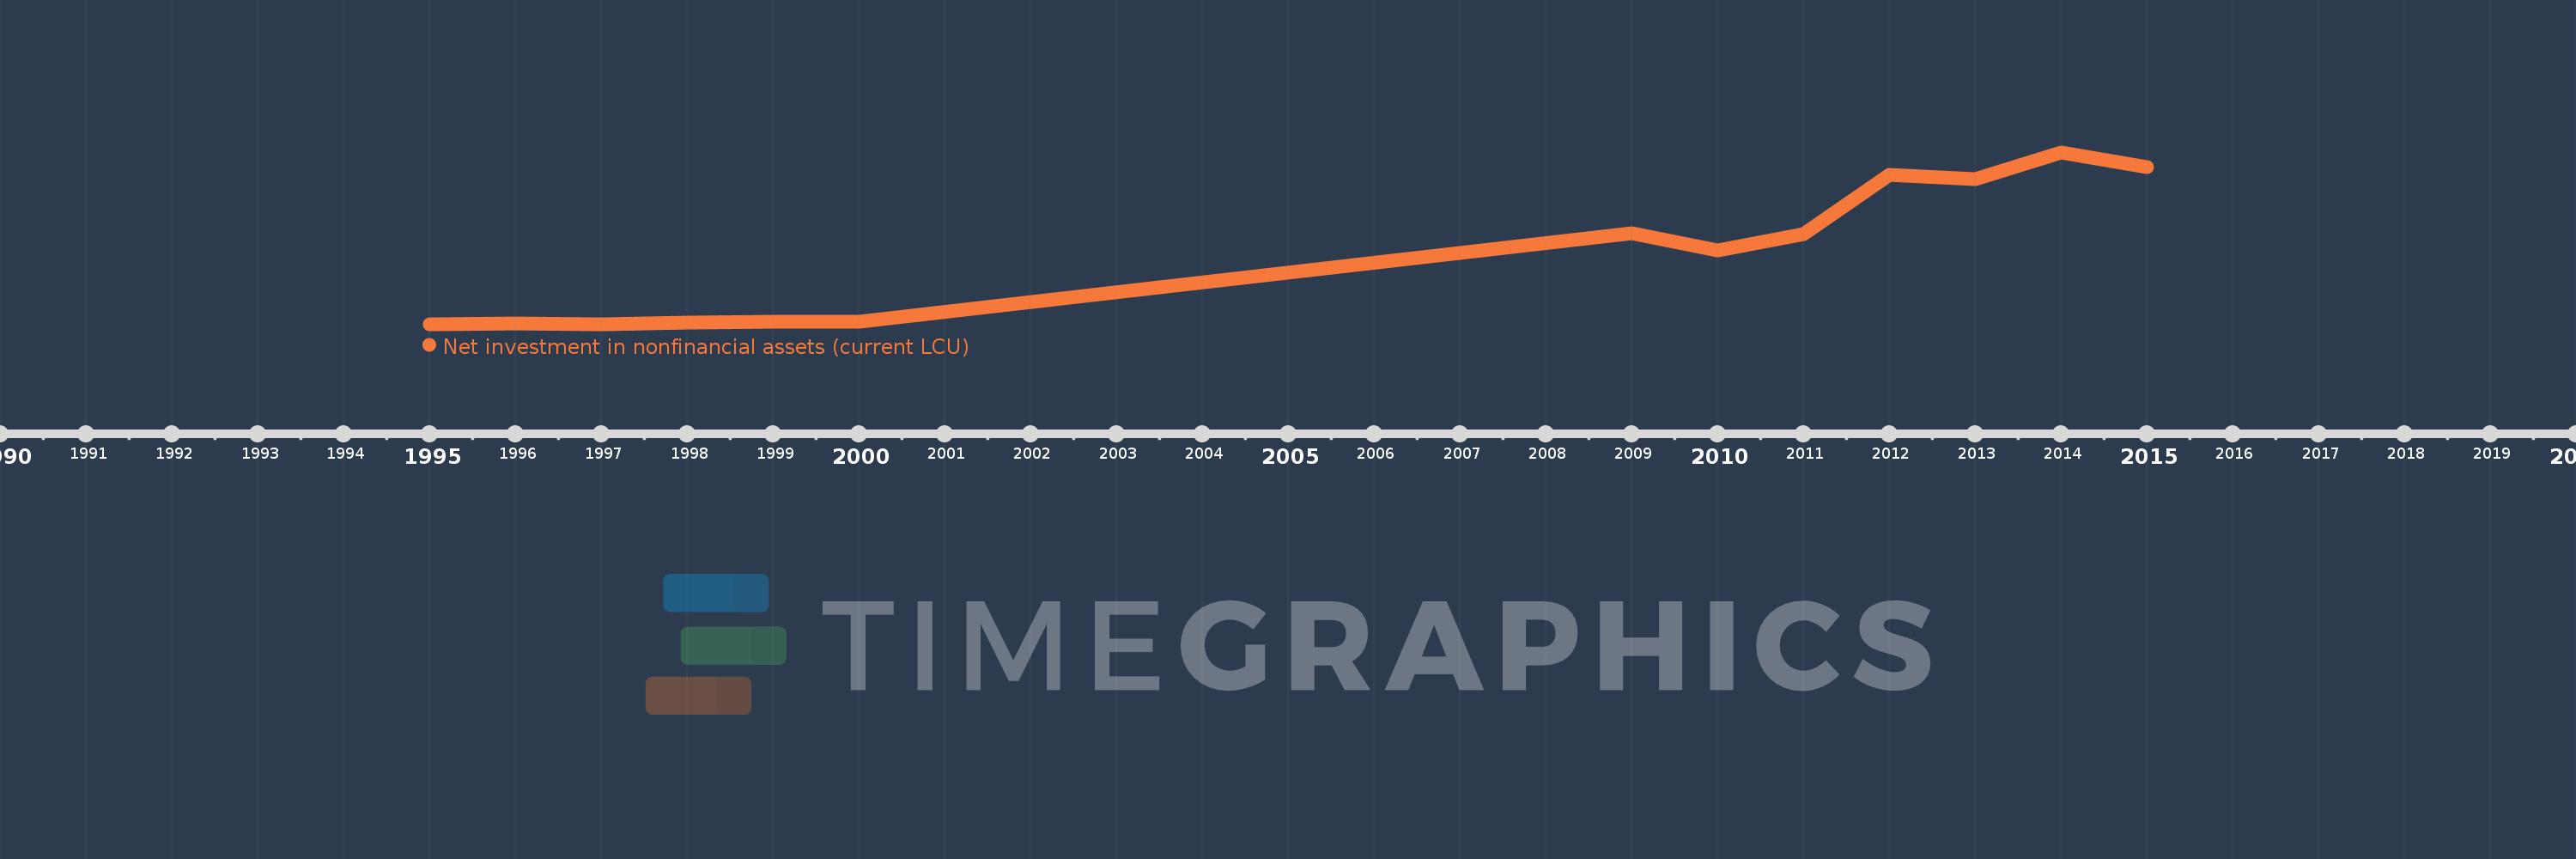
Net investment in nonfinancial assets (current LCU)
2015,2014,2013,2012,2011,2010,2009,2000,1999,1998,1997,1996,1995
This statistics in other country:
AfghanistanAlbaniaAlgeriaAngolaAntigua and BarbudaArmeniaAustraliaAustriaAzerbaijanBahamas, TheBahrainBangladeshBarbadosBelarusBelgiumBelizeBhutanBoliviaBosnia and HerzegovinaBrazilBurundiCabo VerdeCambodiaCanadaCentral African RepublicChileChinaCongo, Dem. Rep.Congo, Rep.Costa RicaCote d'IvoireCroatiaCyprusCzech RepublicDenmarkDominicaDominican RepublicEgypt, Arab Rep.El SalvadorEquatorial GuineaEstoniaEthiopiaFijiFinlandFranceGambia, TheGeorgiaGermanyGreeceGuatemalaHondurasHungaryIcelandIndiaIndonesiaIran, Islamic Rep.IraqIrelandIsraelItalyJamaicaKazakhstanKiribatiKorea, Rep.Kyrgyz RepublicLao PDRLatviaLebanonLithuaniaLuxembourgMacao SAR, ChinaMacedonia, FYRMadagascarMalawiMaldivesMaliMaltaMauritiusMexicoMicronesia, Fed. Sts.MoldovaMongoliaMoroccoMozambiqueNamibiaNepalNetherlandsNew ZealandNicaraguaNigeriaNorwayOmanPakistanParaguayPeruPhilippinesPolandPortugalQatarRomaniaRussian FederationRwandaSamoaSan MarinoSao Tome and PrincipeSenegalSerbiaSierra LeoneSingaporeSlovak RepublicSolomon IslandsSouth AfricaSpainSri LankaSurinameSwazilandSwedenSwitzerlandSyrian Arab RepublicThailandTimor-LesteTrinidad and TobagoTurkeyUgandaUkraineUnited Arab EmiratesUnited KingdomUnited StatesUruguayVanuatuVietnamWest Bank and GazaYemen, Rep.Zimbabwe Timeline:
This timeline shows a graph from 1995 to 2015 of Azerbaijan. No data until 1994. Number of actual observations by date: 13.
Source name:
World Development Indicators
Source organization:
International Monetary Fund, Government Finance Statistics Yearbook and data files.
Categories, topics:
Public Sector
Last updated:
apr 23, 2017
Indicators value changes by year
Minimum:
9.644 mln
jan 1, 1995
Maximum:
8.496 bln
jan 1, 2014
At the date of observation
Value
Absolute change
Change from previous value
jan 1, 1995
9.644 mln
+9.644 mln
0.0%
jan 1, 1996
27.799 mln
+18.155 mln
188.26%
jan 1, 1997
24.759 mln
-3.04 mln
-10.94%
jan 1, 1998
93.395 mln
+68.636 mln
277.22%
jan 1, 1999
152.901 mln
+59.506 mln
63.71%
jan 1, 2000
134.559 mln
-18.342 mln
-12.0%
jan 1, 2009
4.506 bln
+4.372 bln
3.25K%
jan 1, 2010
3.646 bln
-860.7 mln
-19.1%
jan 1, 2011
4.466 bln
+820.4 mln
22.5%
jan 1, 2012
7.375 bln
+2.908 bln
65.12%
jan 1, 2013
7.192 bln
-182.5 mln
-2.47%
jan 1, 2014
8.496 bln
+1.304 bln
18.13%
jan 1, 2015
7.774 bln
-722.5 mln
-8.5%
Ranking of countries by current statistics by years


Comments: