29
/
en
AIzaSyAYiBZKx7MnpbEhh9jyipgxe19OcubqV5w
April 1, 2024
162943
Jamaica
JAM
true
2
1
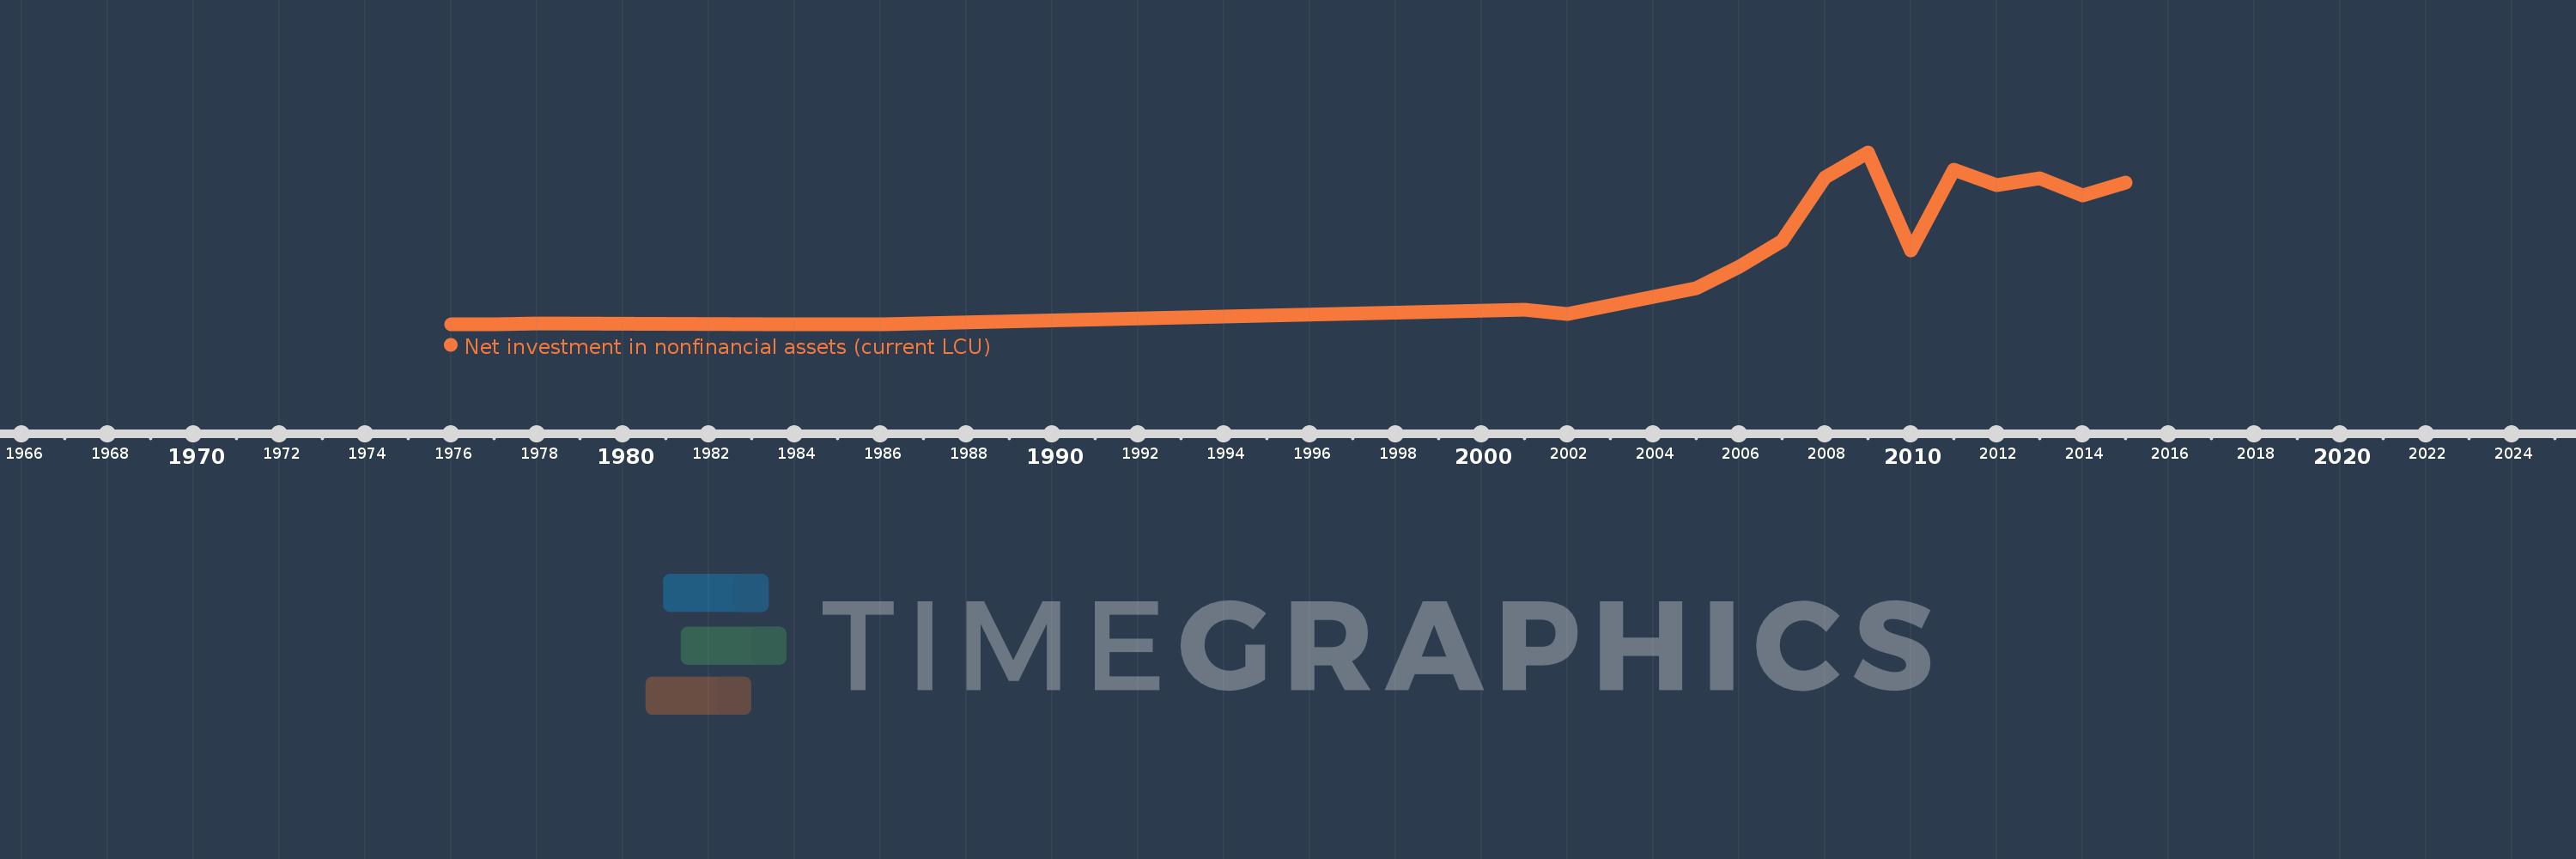
Net investment in nonfinancial assets (current LCU)
2015,2014,2013,2012,2011,2010,2009,2008,2007,2006,2005,2003,2002,2001,1986,1985,1984,1978,1977,1976
This statistics in other country:
AfghanistanAlbaniaAlgeriaAngolaAntigua and BarbudaArmeniaAustraliaAustriaAzerbaijanBahamas, TheBahrainBangladeshBarbadosBelarusBelgiumBelizeBhutanBoliviaBosnia and HerzegovinaBrazilBurundiCabo VerdeCambodiaCanadaCentral African RepublicChileChinaCongo, Dem. Rep.Congo, Rep.Costa RicaCote d'IvoireCroatiaCyprusCzech RepublicDenmarkDominicaDominican RepublicEgypt, Arab Rep.El SalvadorEquatorial GuineaEstoniaEthiopiaFijiFinlandFranceGambia, TheGeorgiaGermanyGreeceGuatemalaHondurasHungaryIcelandIndiaIndonesiaIran, Islamic Rep.IraqIrelandIsraelItalyJamaicaKazakhstanKiribatiKorea, Rep.Kyrgyz RepublicLao PDRLatviaLebanonLithuaniaLuxembourgMacao SAR, ChinaMacedonia, FYRMadagascarMalawiMaldivesMaliMaltaMauritiusMexicoMicronesia, Fed. Sts.MoldovaMongoliaMoroccoMozambiqueNamibiaNepalNetherlandsNew ZealandNicaraguaNigeriaNorwayOmanPakistanParaguayPeruPhilippinesPolandPortugalQatarRomaniaRussian FederationRwandaSamoaSan MarinoSao Tome and PrincipeSenegalSerbiaSierra LeoneSingaporeSlovak RepublicSolomon IslandsSouth AfricaSpainSri LankaSurinameSwazilandSwedenSwitzerlandSyrian Arab RepublicThailandTimor-LesteTrinidad and TobagoTurkeyUgandaUkraineUnited Arab EmiratesUnited KingdomUnited StatesUruguayVanuatuVietnamWest Bank and GazaYemen, Rep.Zimbabwe Timeline:
This timeline shows a graph from 1976 to 2015 of Jamaica. No data until 1975. Number of actual observations by date: 20.
Source name:
World Development Indicators
Source organization:
International Monetary Fund, Government Finance Statistics Yearbook and data files.
Categories, topics:
Public Sector
Last updated:
apr 23, 2017
Indicators value changes by year
Minimum:
101.2 mln
jan 1, 1985
Maximum:
29.226 bln
jan 1, 2009
At the date of observation
Value
Absolute change
Change from previous value
jan 1, 1976
151.2 mln
+151.2 mln
0.0%
jan 1, 1977
133.4 mln
-17.8 mln
-11.77%
jan 1, 1978
165.3 mln
+31.9 mln
23.91%
jan 1, 1984
112.3 mln
-53.0 mln
-32.06%
jan 1, 1985
101.2 mln
-11.1 mln
-9.88%
jan 1, 1986
156.9 mln
+55.7 mln
55.04%
jan 1, 2001
2.595 bln
+2.438 bln
1.55K%
jan 1, 2002
1.825 bln
-770.539 mln
-29.69%
jan 1, 2003
3.298 bln
+1.474 bln
80.76%
jan 1, 2005
6.178 bln
+2.879 bln
87.29%
jan 1, 2006
9.787 bln
+3.609 bln
58.42%
jan 1, 2007
14.236 bln
+4.45 bln
45.47%
jan 1, 2008
24.975 bln
+10.739 bln
75.43%
jan 1, 2009
29.226 bln
+4.251 bln
17.02%
jan 1, 2010
12.628 bln
-16.598 bln
-56.79%
jan 1, 2011
26.322 bln
+13.693 bln
108.43%
jan 1, 2012
23.695 bln
-2.626 bln
-9.98%
jan 1, 2013
24.862 bln
+1.166 bln
4.92%
jan 1, 2014
21.919 bln
-2.942 bln
-11.83%
jan 1, 2015
24.075 bln
+2.156 bln
9.84%
Ranking of countries by current statistics by years


Comments: