29
/
en
AIzaSyAYiBZKx7MnpbEhh9jyipgxe19OcubqV5w
April 1, 2024
69082
Antigua and Barbuda
ATG
true
2
1
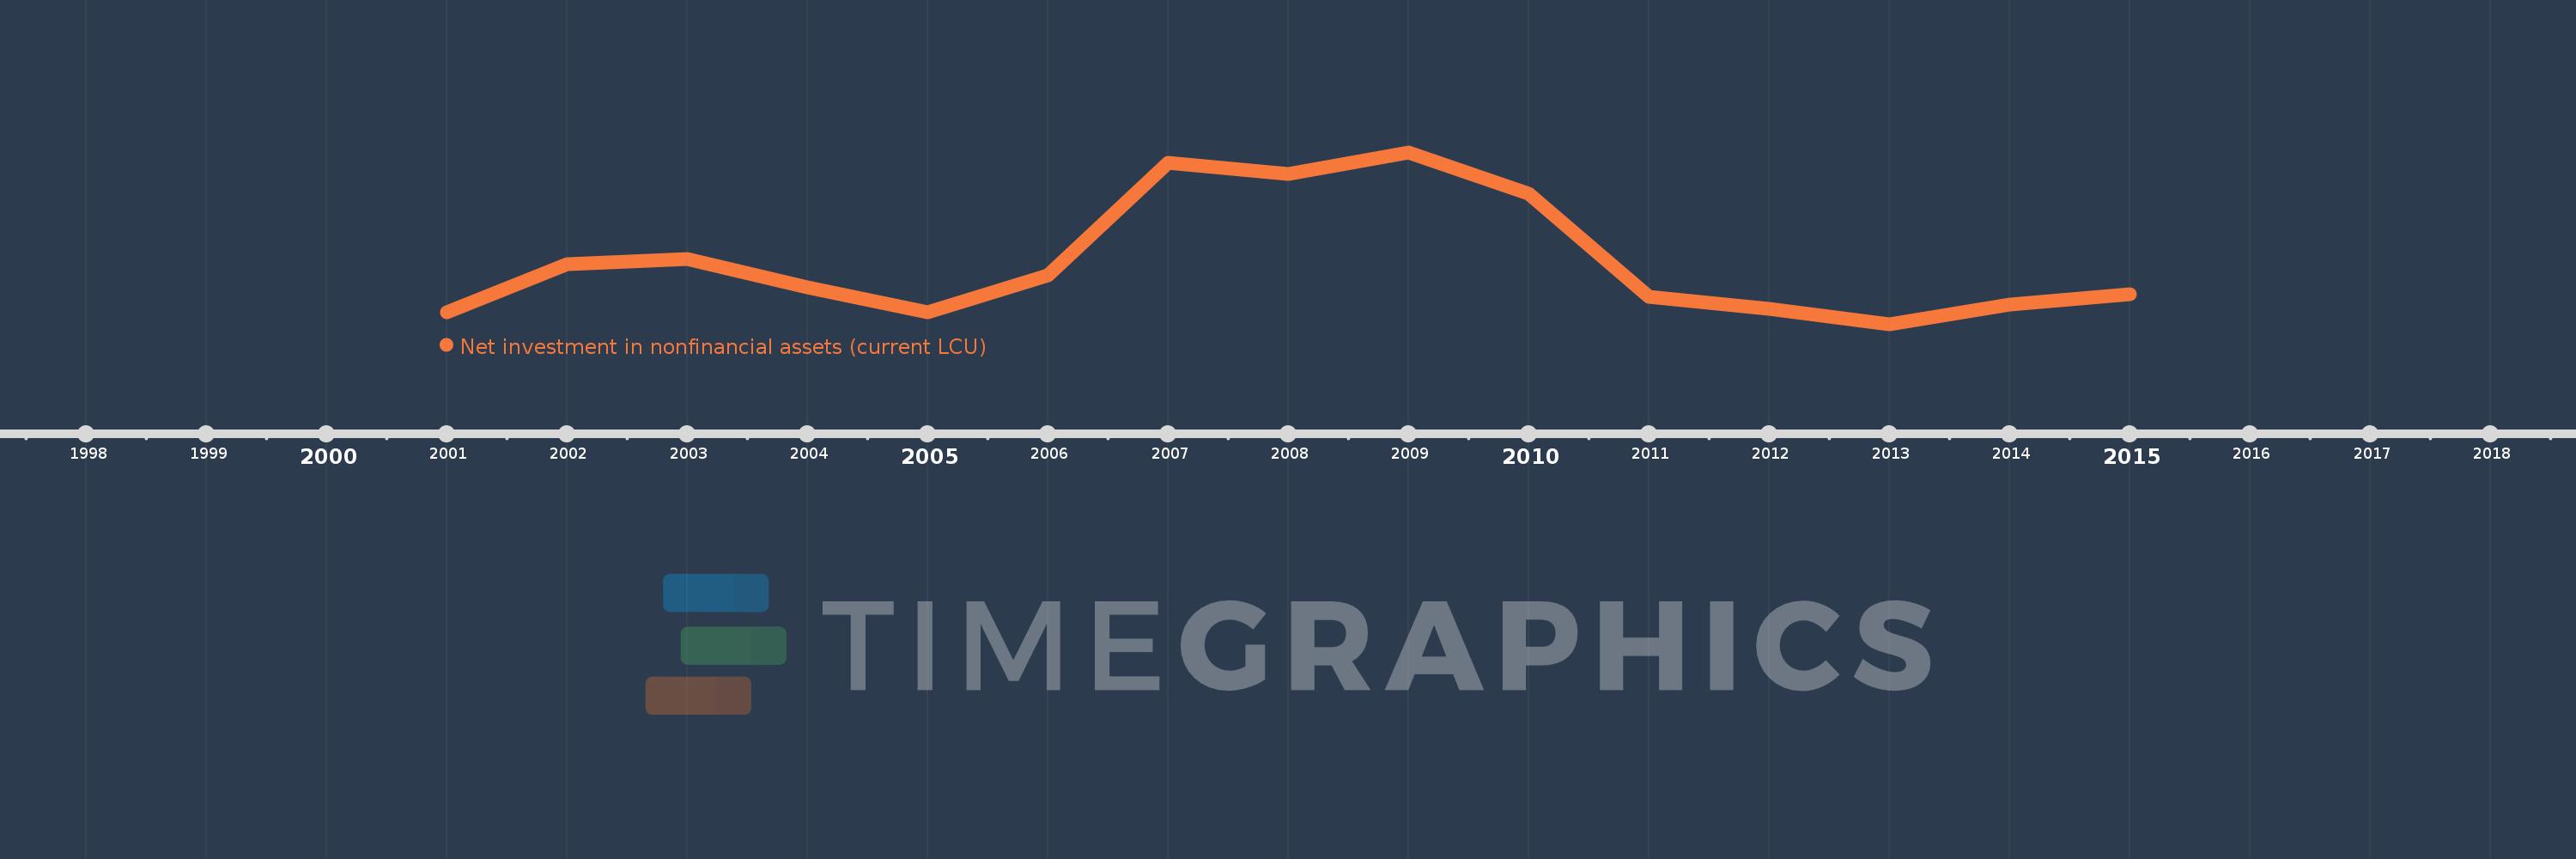
Net investment in nonfinancial assets (current LCU)
2015,2014,2013,2012,2011,2010,2009,2008,2007,2006,2005,2004,2003,2002,2001
This statistics in other country:
AfghanistanAlbaniaAlgeriaAngolaAntigua and BarbudaArmeniaAustraliaAustriaAzerbaijanBahamas, TheBahrainBangladeshBarbadosBelarusBelgiumBelizeBhutanBoliviaBosnia and HerzegovinaBrazilBurundiCabo VerdeCambodiaCanadaCentral African RepublicChileChinaCongo, Dem. Rep.Congo, Rep.Costa RicaCote d'IvoireCroatiaCyprusCzech RepublicDenmarkDominicaDominican RepublicEgypt, Arab Rep.El SalvadorEquatorial GuineaEstoniaEthiopiaFijiFinlandFranceGambia, TheGeorgiaGermanyGreeceGuatemalaHondurasHungaryIcelandIndiaIndonesiaIran, Islamic Rep.IraqIrelandIsraelItalyJamaicaKazakhstanKiribatiKorea, Rep.Kyrgyz RepublicLao PDRLatviaLebanonLithuaniaLuxembourgMacao SAR, ChinaMacedonia, FYRMadagascarMalawiMaldivesMaliMaltaMauritiusMexicoMicronesia, Fed. Sts.MoldovaMongoliaMoroccoMozambiqueNamibiaNepalNetherlandsNew ZealandNicaraguaNigeriaNorwayOmanPakistanParaguayPeruPhilippinesPolandPortugalQatarRomaniaRussian FederationRwandaSamoaSan MarinoSao Tome and PrincipeSenegalSerbiaSierra LeoneSingaporeSlovak RepublicSolomon IslandsSouth AfricaSpainSri LankaSurinameSwazilandSwedenSwitzerlandSyrian Arab RepublicThailandTimor-LesteTrinidad and TobagoTurkeyUgandaUkraineUnited Arab EmiratesUnited KingdomUnited StatesUruguayVanuatuVietnamWest Bank and GazaYemen, Rep.Zimbabwe Timeline:
This timeline shows a graph from 2001 to 2015 of Antigua and Barbuda. No data until 2000. Number of actual observations by date: 15.
Source name:
World Development Indicators
Source organization:
International Monetary Fund, Government Finance Statistics Yearbook and data files.
Categories, topics:
Public Sector
Last updated:
apr 23, 2017
Indicators value changes by year
Minimum:
18.683 mln
jan 1, 2013
Maximum:
220.695 mln
jan 1, 2009
At the date of observation
Value
Absolute change
Change from previous value
jan 1, 2001
32.28 mln
+32.28 mln
0.0%
jan 1, 2002
88.94 mln
+56.66 mln
175.53%
jan 1, 2003
95.63 mln
+6.69 mln
7.52%
jan 1, 2004
62.41 mln
-33.22 mln
-34.74%
jan 1, 2005
33.116 mln
-29.294 mln
-46.94%
jan 1, 2006
76.21 mln
+43.094 mln
130.13%
jan 1, 2007
208.607 mln
+132.397 mln
173.73%
jan 1, 2008
195.362 mln
-13.245 mln
-6.35%
jan 1, 2009
220.695 mln
+25.333 mln
12.97%
jan 1, 2010
172.516 mln
-48.179 mln
-21.83%
jan 1, 2011
50.669 mln
-121.846 mln
-70.63%
jan 1, 2012
37.117 mln
-13.553 mln
-26.75%
jan 1, 2013
18.683 mln
-18.434 mln
-49.67%
jan 1, 2014
41.777 mln
+23.094 mln
123.61%
jan 1, 2015
53.697 mln
+11.92 mln
28.53%
Ranking of countries by current statistics by years


Comments: