29
/
en
AIzaSyAYiBZKx7MnpbEhh9jyipgxe19OcubqV5w
April 1, 2024
254434
Suriname
SUR
true
2
1
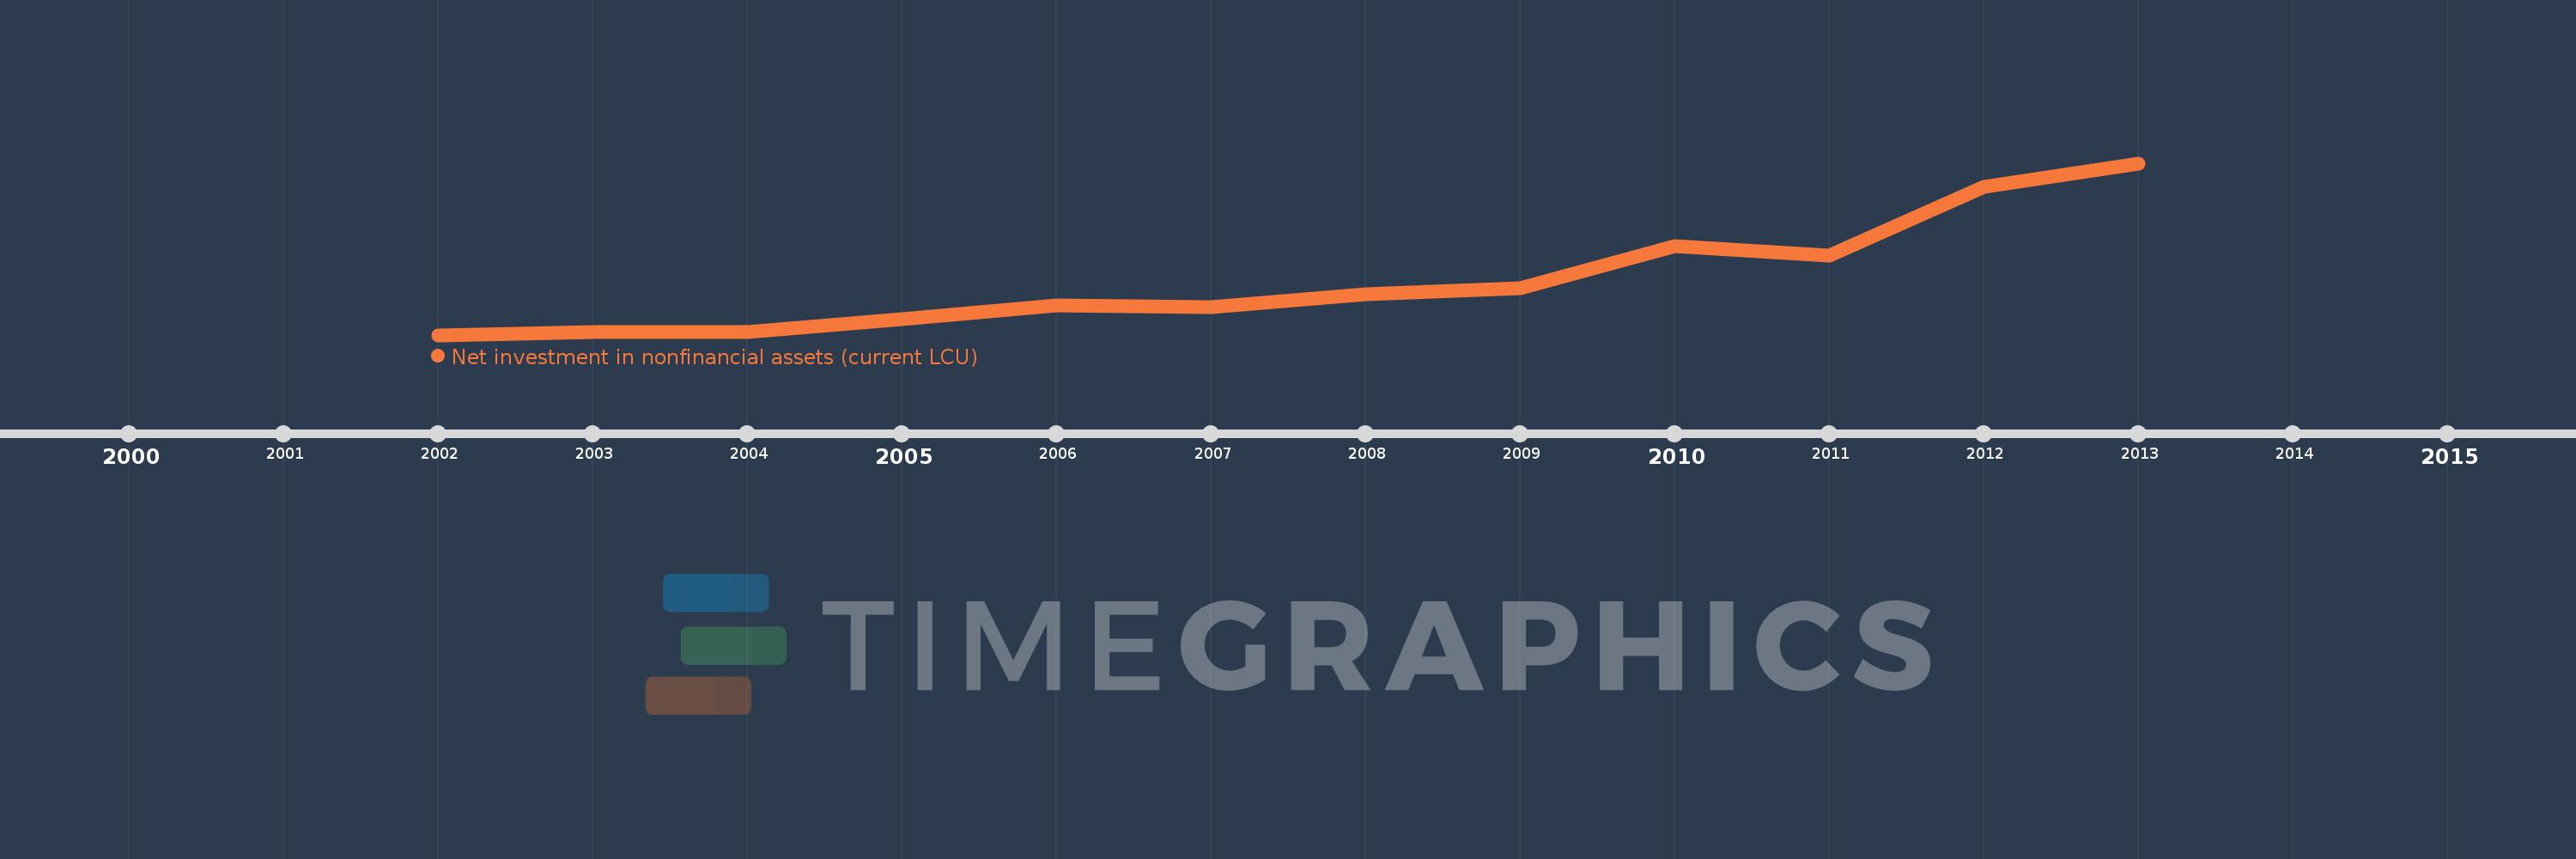
Net investment in nonfinancial assets (current LCU)
2013,2012,2011,2010,2009,2008,2007,2006,2005,2004,2003,2002
This statistics in other country:
AfghanistanAlbaniaAlgeriaAngolaAntigua and BarbudaArmeniaAustraliaAustriaAzerbaijanBahamas, TheBahrainBangladeshBarbadosBelarusBelgiumBelizeBhutanBoliviaBosnia and HerzegovinaBrazilBurundiCabo VerdeCambodiaCanadaCentral African RepublicChileChinaCongo, Dem. Rep.Congo, Rep.Costa RicaCote d'IvoireCroatiaCyprusCzech RepublicDenmarkDominicaDominican RepublicEgypt, Arab Rep.El SalvadorEquatorial GuineaEstoniaEthiopiaFijiFinlandFranceGambia, TheGeorgiaGermanyGreeceGuatemalaHondurasHungaryIcelandIndiaIndonesiaIran, Islamic Rep.IraqIrelandIsraelItalyJamaicaKazakhstanKiribatiKorea, Rep.Kyrgyz RepublicLao PDRLatviaLebanonLithuaniaLuxembourgMacao SAR, ChinaMacedonia, FYRMadagascarMalawiMaldivesMaliMaltaMauritiusMexicoMicronesia, Fed. Sts.MoldovaMongoliaMoroccoMozambiqueNamibiaNepalNetherlandsNew ZealandNicaraguaNigeriaNorwayOmanPakistanParaguayPeruPhilippinesPolandPortugalQatarRomaniaRussian FederationRwandaSamoaSan MarinoSao Tome and PrincipeSenegalSerbiaSierra LeoneSingaporeSlovak RepublicSolomon IslandsSouth AfricaSpainSri LankaSurinameSwazilandSwedenSwitzerlandSyrian Arab RepublicThailandTimor-LesteTrinidad and TobagoTurkeyUgandaUkraineUnited Arab EmiratesUnited KingdomUnited StatesUruguayVanuatuVietnamWest Bank and GazaYemen, Rep.Zimbabwe Timeline:
This timeline shows a graph from 2002 to 2013 of Suriname. No data until 2001. Number of actual observations by date: 12.
Source name:
World Development Indicators
Source organization:
International Monetary Fund, Government Finance Statistics Yearbook and data files.
Categories, topics:
Public Sector
Last updated:
apr 23, 2017
Indicators value changes by year
Minimum:
33.067 mln
jan 1, 2002
Maximum:
728.385 mln
jan 1, 2013
At the date of observation
Value
Absolute change
Change from previous value
jan 1, 2002
33.067 mln
+33.067 mln
0.0%
jan 1, 2003
43.881 mln
+10.814 mln
32.7%
jan 1, 2004
43.576 mln
-305.298K
-0.7%
jan 1, 2005
97.209 mln
+53.633 mln
123.08%
jan 1, 2006
152.683 mln
+55.473 mln
57.07%
jan 1, 2007
145.983 mln
-6.7 mln
-4.39%
jan 1, 2008
197.854 mln
+51.872 mln
35.53%
jan 1, 2009
222.453 mln
+24.599 mln
12.43%
jan 1, 2010
391.621 mln
+169.168 mln
76.05%
jan 1, 2011
353.522 mln
-38.099 mln
-9.73%
jan 1, 2012
631.521 mln
+277.999 mln
78.64%
jan 1, 2013
728.385 mln
+96.864 mln
15.34%
Ranking of countries by current statistics by years


Comments: