29
/
en
AIzaSyAYiBZKx7MnpbEhh9jyipgxe19OcubqV5w
April 1, 2024
110044
Congo, Dem. Rep.
COD
true
2
1
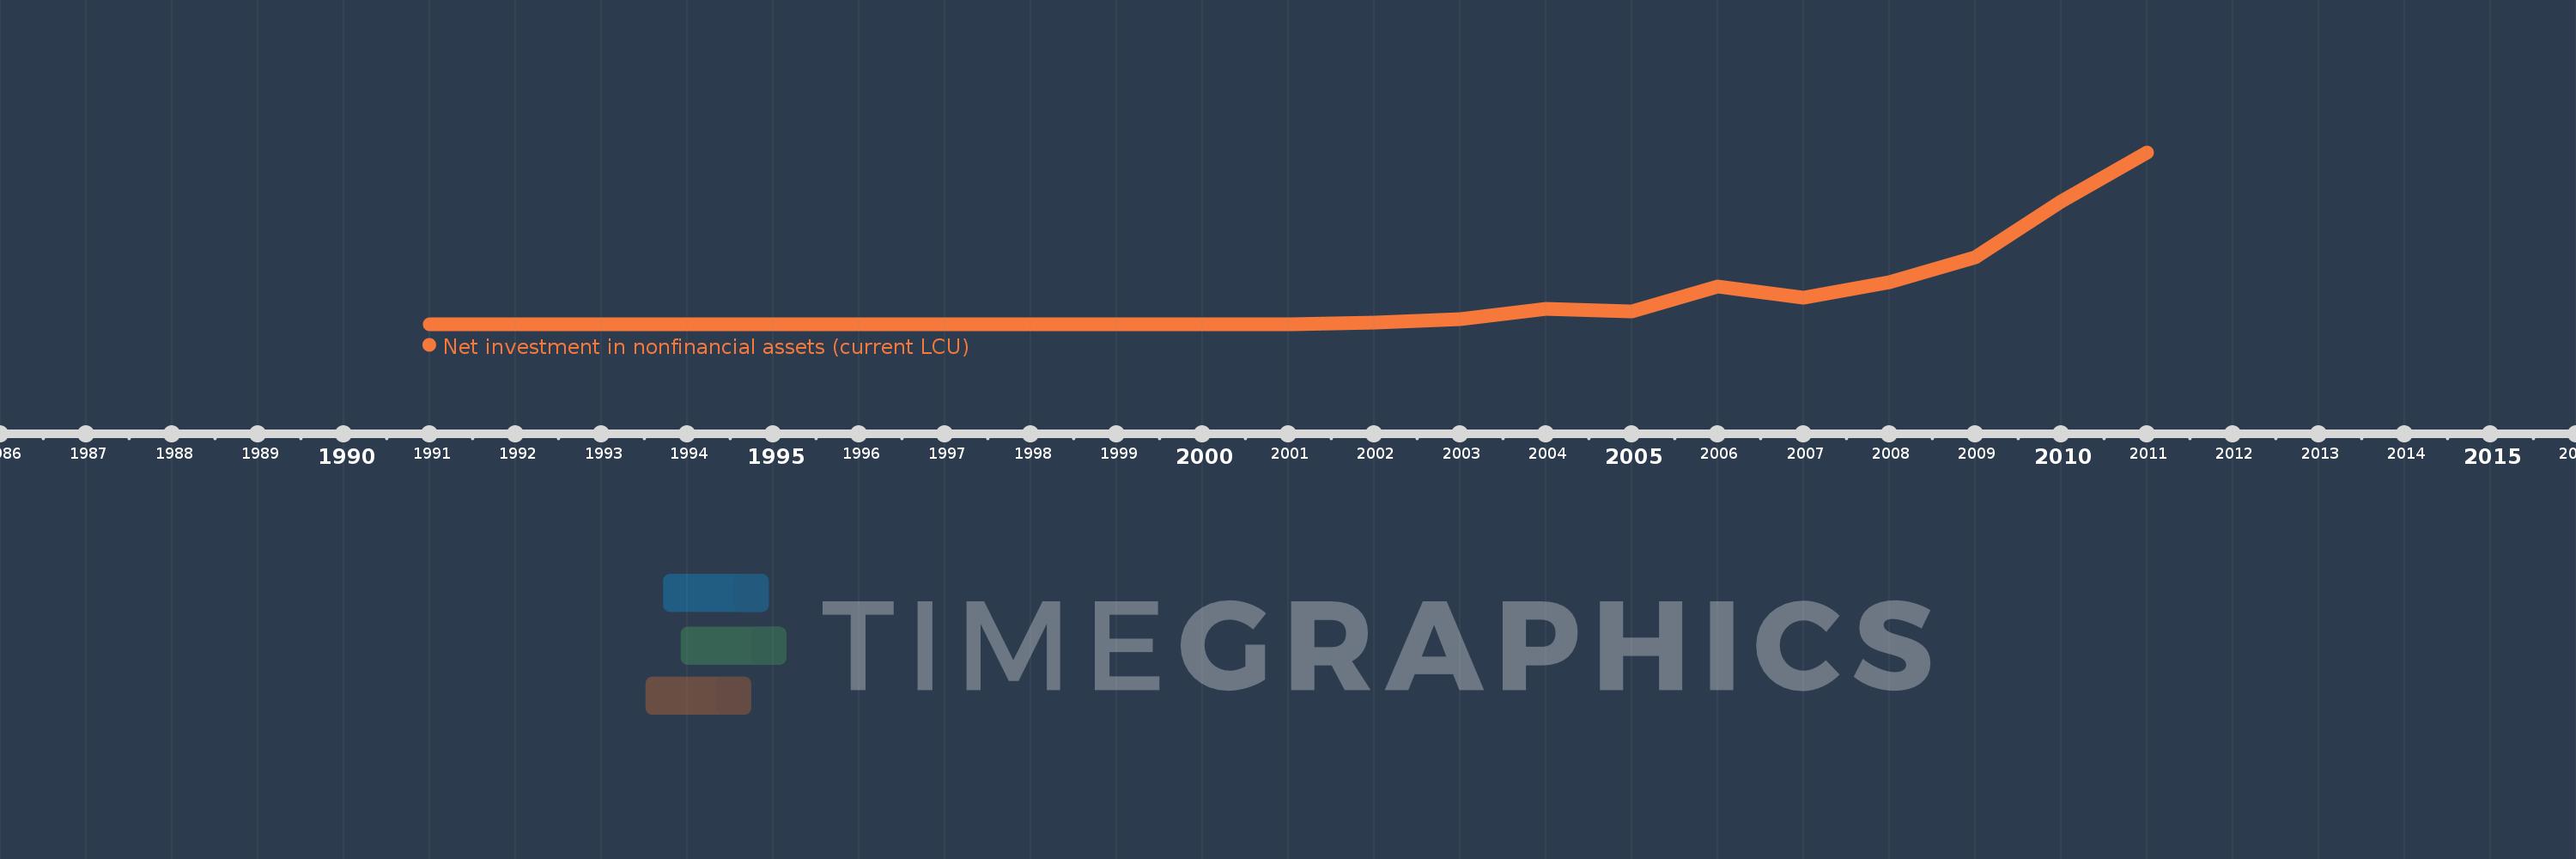
Net investment in nonfinancial assets (current LCU)
2011,2010,2009,2008,2007,2006,2005,2004,2003,2002,2001,2000,1999,1998,1997,1996,1995,1994,1993,1992,1991
This statistics in other country:
AfghanistanAlbaniaAlgeriaAngolaAntigua and BarbudaArmeniaAustraliaAustriaAzerbaijanBahamas, TheBahrainBangladeshBarbadosBelarusBelgiumBelizeBhutanBoliviaBosnia and HerzegovinaBrazilBurundiCabo VerdeCambodiaCanadaCentral African RepublicChileChinaCongo, Dem. Rep.Congo, Rep.Costa RicaCote d'IvoireCroatiaCyprusCzech RepublicDenmarkDominicaDominican RepublicEgypt, Arab Rep.El SalvadorEquatorial GuineaEstoniaEthiopiaFijiFinlandFranceGambia, TheGeorgiaGermanyGreeceGuatemalaHondurasHungaryIcelandIndiaIndonesiaIran, Islamic Rep.IraqIrelandIsraelItalyJamaicaKazakhstanKiribatiKorea, Rep.Kyrgyz RepublicLao PDRLatviaLebanonLithuaniaLuxembourgMacao SAR, ChinaMacedonia, FYRMadagascarMalawiMaldivesMaliMaltaMauritiusMexicoMicronesia, Fed. Sts.MoldovaMongoliaMoroccoMozambiqueNamibiaNepalNetherlandsNew ZealandNicaraguaNigeriaNorwayOmanPakistanParaguayPeruPhilippinesPolandPortugalQatarRomaniaRussian FederationRwandaSamoaSan MarinoSao Tome and PrincipeSenegalSerbiaSierra LeoneSingaporeSlovak RepublicSolomon IslandsSouth AfricaSpainSri LankaSurinameSwazilandSwedenSwitzerlandSyrian Arab RepublicThailandTimor-LesteTrinidad and TobagoTurkeyUgandaUkraineUnited Arab EmiratesUnited KingdomUnited StatesUruguayVanuatuVietnamWest Bank and GazaYemen, Rep.Zimbabwe Timeline:
This timeline shows a graph from 1991 to 2011 of Congo, Dem. Rep.. No data until 1990. Number of actual observations by date: 21.
Source name:
World Development Indicators
Source organization:
International Monetary Fund, Government Finance Statistics Yearbook and data files.
Categories, topics:
Public Sector
Last updated:
apr 23, 2017
Indicators value changes by year
Maximum:
1.946 trl
jan 1, 2011
At the date of observation
Value
Absolute change
Change from previous value
jan 1, 1991
0.155
+0.155
0.0%
jan 1, 1992
3.173
+3.018
1.94K%
jan 1, 1993
133.007
+129.833
4.09K%
jan 1, 1994
1.1K
+966.993
727.03%
jan 1, 1995
134.37K
+133.27K
12.12K%
jan 1, 1996
350.0K
+215.63K
160.47%
jan 1, 1997
4.41 mln
+4.06 mln
1.16K%
jan 1, 1998
12.88 mln
+8.47 mln
192.06%
jan 1, 1999
1.125 mln
-11.755 mln
-91.27%
jan 1, 2000
554.0 mln
+552.875 mln
49.14K%
jan 1, 2001
2.809 bln
+2.255 bln
407.06%
jan 1, 2002
22.8 bln
+19.991 bln
711.64%
jan 1, 2003
54.736 bln
+31.936 bln
140.07%
jan 1, 2004
178.474 bln
+123.738 bln
226.07%
jan 1, 2005
140.407 bln
-38.067 bln
-21.33%
jan 1, 2006
429.757 bln
+289.349 bln
206.08%
jan 1, 2007
298.076 bln
-131.681 bln
-30.64%
jan 1, 2008
477.424 bln
+179.348 bln
60.17%
jan 1, 2009
758.46 bln
+281.036 bln
58.86%
jan 1, 2010
1.388 trl
+629.739 bln
83.03%
jan 1, 2011
1.946 trl
+557.771 bln
40.18%
Ranking of countries by current statistics by years


Comments: