29
/
en
AIzaSyAYiBZKx7MnpbEhh9jyipgxe19OcubqV5w
April 1, 2024
205608
Namibia
NAM
true
2
1
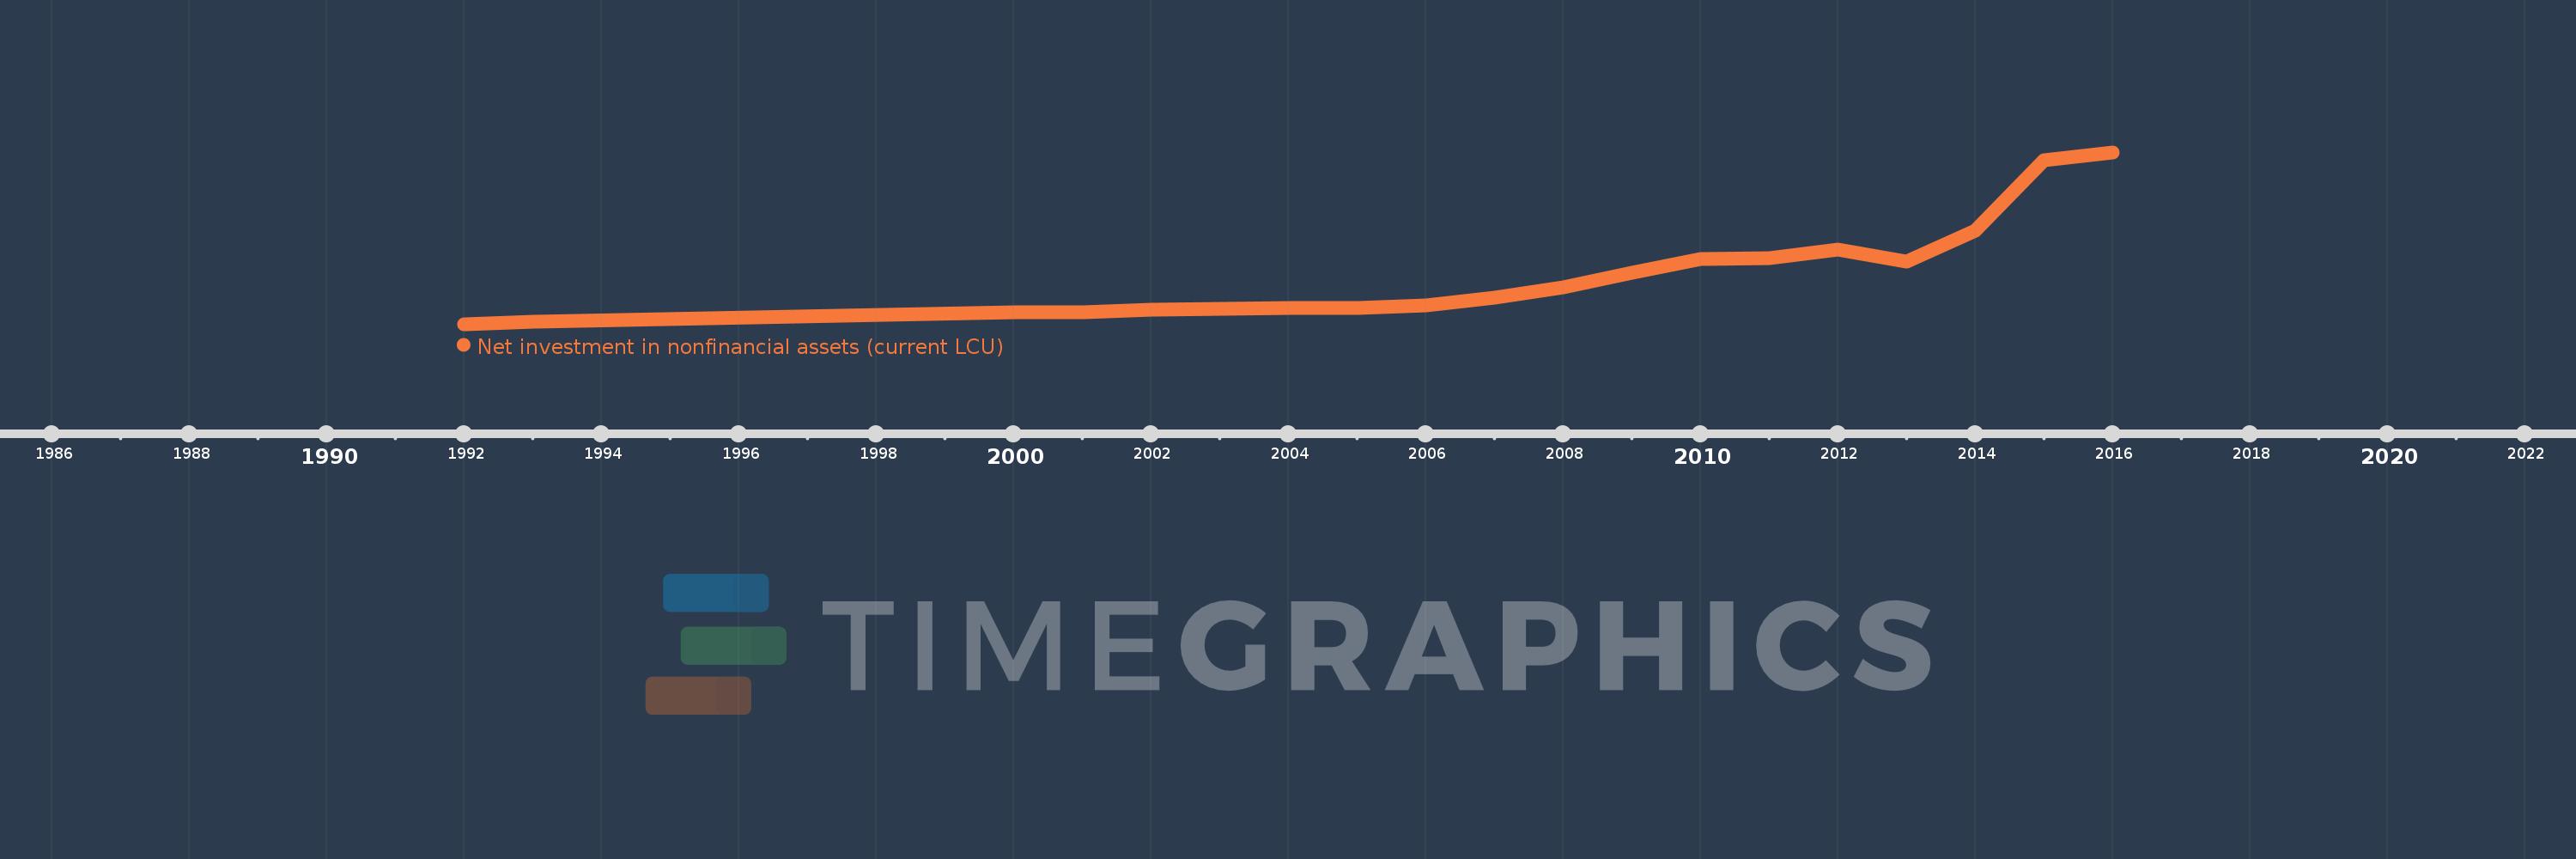
Net investment in nonfinancial assets (current LCU)
2016,2015,2014,2013,2012,2011,2010,2009,2008,2007,2006,2005,2004,2003,2002,2001,2000,1993,1992
This statistics in other country:
AfghanistanAlbaniaAlgeriaAngolaAntigua and BarbudaArmeniaAustraliaAustriaAzerbaijanBahamas, TheBahrainBangladeshBarbadosBelarusBelgiumBelizeBhutanBoliviaBosnia and HerzegovinaBrazilBurundiCabo VerdeCambodiaCanadaCentral African RepublicChileChinaCongo, Dem. Rep.Congo, Rep.Costa RicaCote d'IvoireCroatiaCyprusCzech RepublicDenmarkDominicaDominican RepublicEgypt, Arab Rep.El SalvadorEquatorial GuineaEstoniaEthiopiaFijiFinlandFranceGambia, TheGeorgiaGermanyGreeceGuatemalaHondurasHungaryIcelandIndiaIndonesiaIran, Islamic Rep.IraqIrelandIsraelItalyJamaicaKazakhstanKiribatiKorea, Rep.Kyrgyz RepublicLao PDRLatviaLebanonLithuaniaLuxembourgMacao SAR, ChinaMacedonia, FYRMadagascarMalawiMaldivesMaliMaltaMauritiusMexicoMicronesia, Fed. Sts.MoldovaMongoliaMoroccoMozambiqueNamibiaNepalNetherlandsNew ZealandNicaraguaNigeriaNorwayOmanPakistanParaguayPeruPhilippinesPolandPortugalQatarRomaniaRussian FederationRwandaSamoaSan MarinoSao Tome and PrincipeSenegalSerbiaSierra LeoneSingaporeSlovak RepublicSolomon IslandsSouth AfricaSpainSri LankaSurinameSwazilandSwedenSwitzerlandSyrian Arab RepublicThailandTimor-LesteTrinidad and TobagoTurkeyUgandaUkraineUnited Arab EmiratesUnited KingdomUnited StatesUruguayVanuatuVietnamWest Bank and GazaYemen, Rep.Zimbabwe Timeline:
This timeline shows a graph from 1992 to 2016 of Namibia. No data until 1991. Number of actual observations by date: 19.
Source name:
World Development Indicators
Source organization:
International Monetary Fund, Government Finance Statistics Yearbook and data files.
Categories, topics:
Public Sector
Last updated:
apr 23, 2017
Indicators value changes by year
Minimum:
320.8 mln
jan 1, 1992
Maximum:
9.055 bln
jan 1, 2016
At the date of observation
Value
Absolute change
Change from previous value
jan 1, 1992
320.8 mln
+320.8 mln
0.0%
jan 1, 1993
440.7 mln
+119.9 mln
37.38%
jan 1, 2000
917.5 mln
+476.8 mln
108.19%
jan 1, 2001
924.197 mln
+6.697 mln
0.73%
jan 1, 2002
1.037 bln
+113.179 mln
12.25%
jan 1, 2003
1.1 bln
+63.064 mln
6.08%
jan 1, 2004
1.149 bln
+48.951 mln
4.45%
jan 1, 2005
1.147 bln
-2.814 mln
-0.24%
jan 1, 2006
1.256 bln
+109.792 mln
9.58%
jan 1, 2007
1.662 bln
+406.077 mln
32.32%
jan 1, 2008
2.198 bln
+535.19 mln
32.19%
jan 1, 2009
2.924 bln
+726.826 mln
33.07%
jan 1, 2010
3.625 bln
+700.34 mln
23.95%
jan 1, 2011
3.701 bln
+75.731 mln
2.09%
jan 1, 2012
4.096 bln
+395.187 mln
10.68%
jan 1, 2013
3.516 bln
-580.175 mln
-14.17%
jan 1, 2014
5.098 bln
+1.582 bln
45.0%
jan 1, 2015
8.646 bln
+3.549 bln
69.62%
jan 1, 2016
9.055 bln
+408.779 mln
4.73%
Ranking of countries by current statistics by years


Comments: