29
/
en
AIzaSyAYiBZKx7MnpbEhh9jyipgxe19OcubqV5w
April 1, 2024
175665
Latvia
LVA
true
2
1
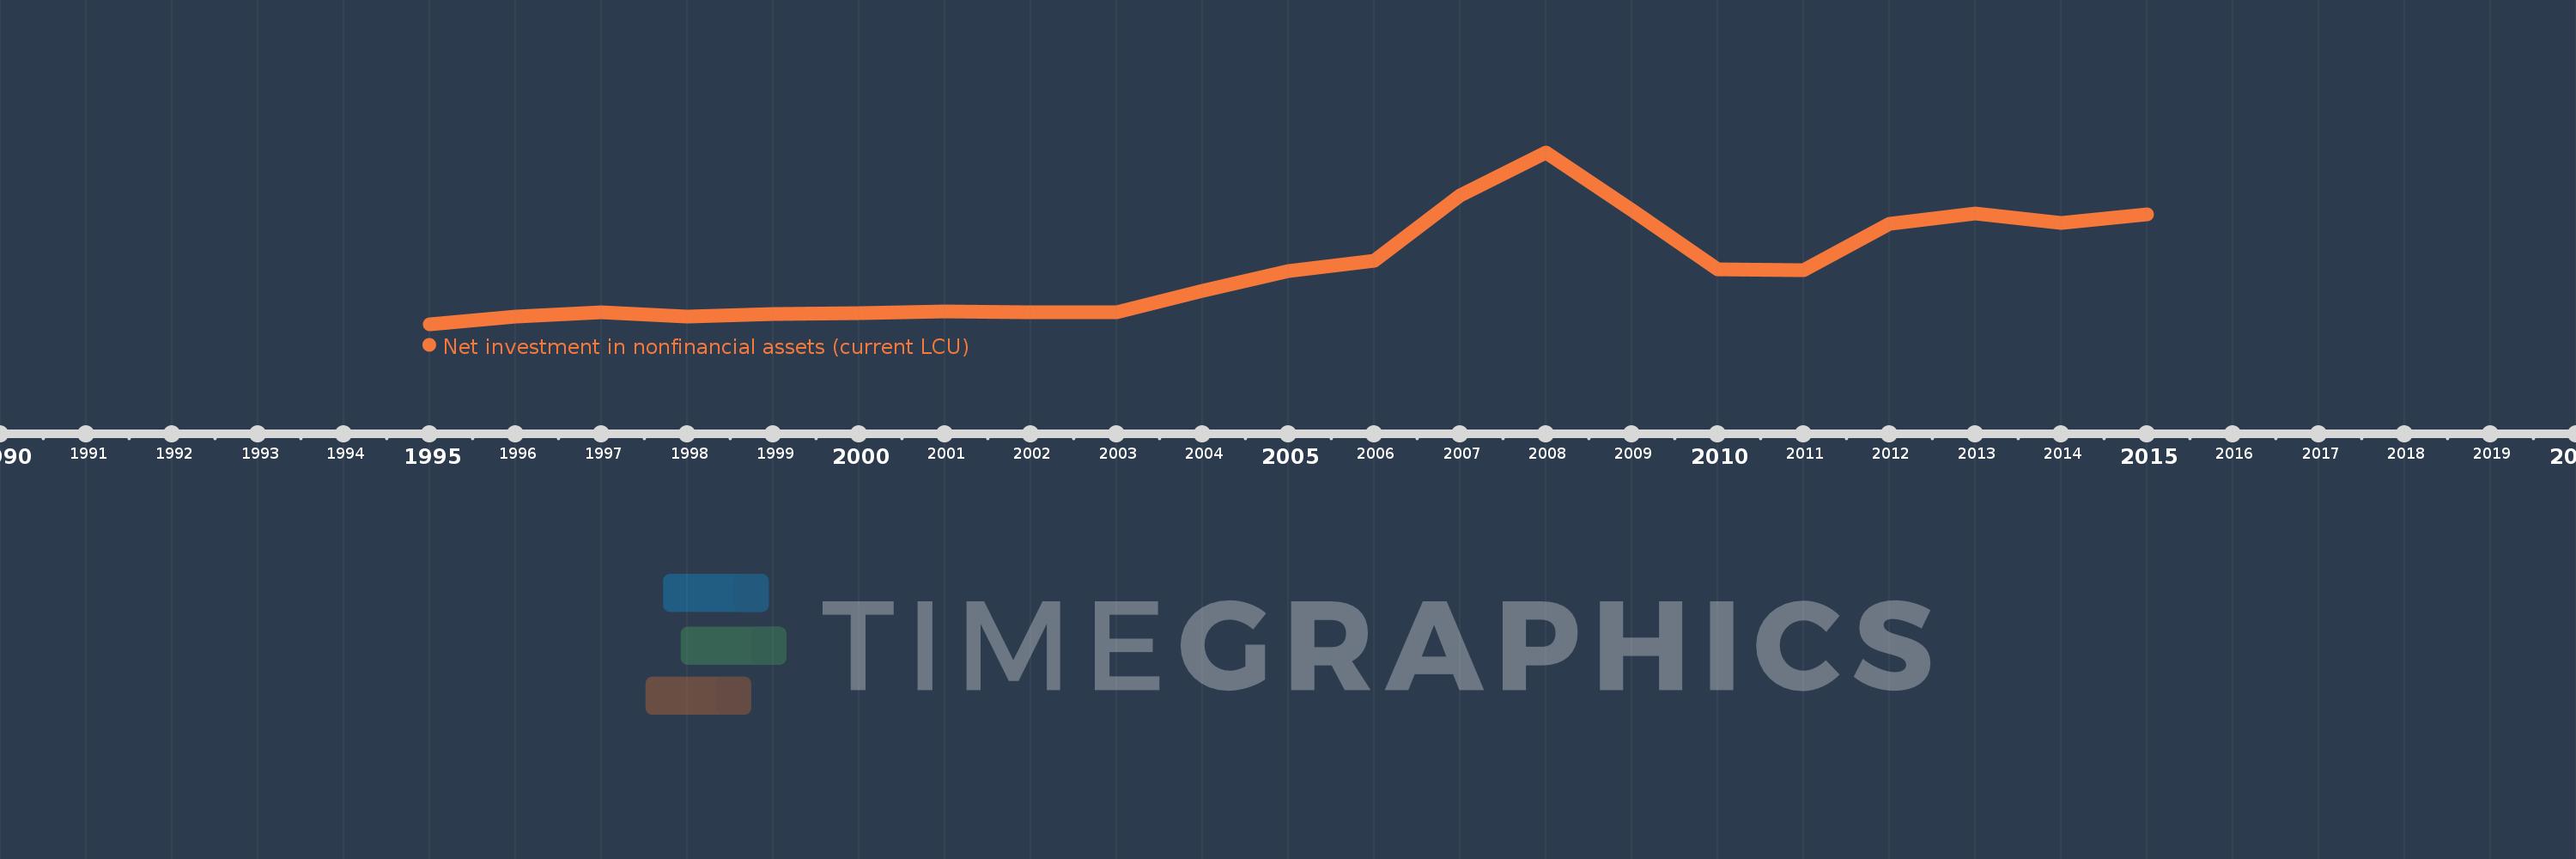
Net investment in nonfinancial assets (current LCU)
2015,2014,2013,2012,2011,2010,2009,2008,2007,2006,2005,2004,2003,2002,2001,2000,1999,1998,1997,1996,1995
This statistics in other country:
AfghanistanAlbaniaAlgeriaAngolaAntigua and BarbudaArmeniaAustraliaAustriaAzerbaijanBahamas, TheBahrainBangladeshBarbadosBelarusBelgiumBelizeBhutanBoliviaBosnia and HerzegovinaBrazilBurundiCabo VerdeCambodiaCanadaCentral African RepublicChileChinaCongo, Dem. Rep.Congo, Rep.Costa RicaCote d'IvoireCroatiaCyprusCzech RepublicDenmarkDominicaDominican RepublicEgypt, Arab Rep.El SalvadorEquatorial GuineaEstoniaEthiopiaFijiFinlandFranceGambia, TheGeorgiaGermanyGreeceGuatemalaHondurasHungaryIcelandIndiaIndonesiaIran, Islamic Rep.IraqIrelandIsraelItalyJamaicaKazakhstanKiribatiKorea, Rep.Kyrgyz RepublicLao PDRLatviaLebanonLithuaniaLuxembourgMacao SAR, ChinaMacedonia, FYRMadagascarMalawiMaldivesMaliMaltaMauritiusMexicoMicronesia, Fed. Sts.MoldovaMongoliaMoroccoMozambiqueNamibiaNepalNetherlandsNew ZealandNicaraguaNigeriaNorwayOmanPakistanParaguayPeruPhilippinesPolandPortugalQatarRomaniaRussian FederationRwandaSamoaSan MarinoSao Tome and PrincipeSenegalSerbiaSierra LeoneSingaporeSlovak RepublicSolomon IslandsSouth AfricaSpainSri LankaSurinameSwazilandSwedenSwitzerlandSyrian Arab RepublicThailandTimor-LesteTrinidad and TobagoTurkeyUgandaUkraineUnited Arab EmiratesUnited KingdomUnited StatesUruguayVanuatuVietnamWest Bank and GazaYemen, Rep.Zimbabwe Timeline:
This timeline shows a graph from 1995 to 2015 of Latvia. No data until 1994. Number of actual observations by date: 21.
Source name:
World Development Indicators
Source organization:
International Monetary Fund, Government Finance Statistics Yearbook and data files.
Categories, topics:
Public Sector
Last updated:
apr 23, 2017
Indicators value changes by year
Minimum:
26.764 mln
jan 1, 1995
Maximum:
1.223 bln
jan 1, 2008
At the date of observation
Value
Absolute change
Change from previous value
jan 1, 1995
26.764 mln
+26.764 mln
0.0%
jan 1, 1996
77.333 mln
+50.569 mln
188.94%
jan 1, 1997
112.236 mln
+34.903 mln
45.13%
jan 1, 1998
77.091 mln
-35.145 mln
-31.31%
jan 1, 1999
96.215 mln
+19.123 mln
24.81%
jan 1, 2000
104.04 mln
+7.826 mln
8.13%
jan 1, 2001
117.529 mln
+13.489 mln
12.96%
jan 1, 2002
107.626 mln
-9.903 mln
-8.43%
jan 1, 2003
107.711 mln
+85.372K
0.08%
jan 1, 2004
260.073 mln
+152.361 mln
141.45%
jan 1, 2005
397.451 mln
+137.378 mln
52.82%
jan 1, 2006
469.875 mln
+72.424 mln
18.22%
jan 1, 2007
920.783 mln
+450.908 mln
95.96%
jan 1, 2008
1.223 bln
+302.374 mln
32.84%
jan 1, 2009
821.239 mln
-401.919 mln
-32.86%
jan 1, 2010
408.478 mln
-412.761 mln
-50.26%
jan 1, 2011
402.16 mln
-6.318 mln
-1.55%
jan 1, 2012
723.886 mln
+321.726 mln
80.0%
jan 1, 2013
795.542 mln
+71.656 mln
9.9%
jan 1, 2014
732.992 mln
-62.549 mln
-7.86%
jan 1, 2015
793.422 mln
+60.429 mln
8.24%
Ranking of countries by current statistics by years


Comments: