30
/
AIzaSyAYiBZKx7MnpbEhh9jyipgxe19OcubqV5w
April 1, 2024
81779
Belgium
BEL
true
2
1
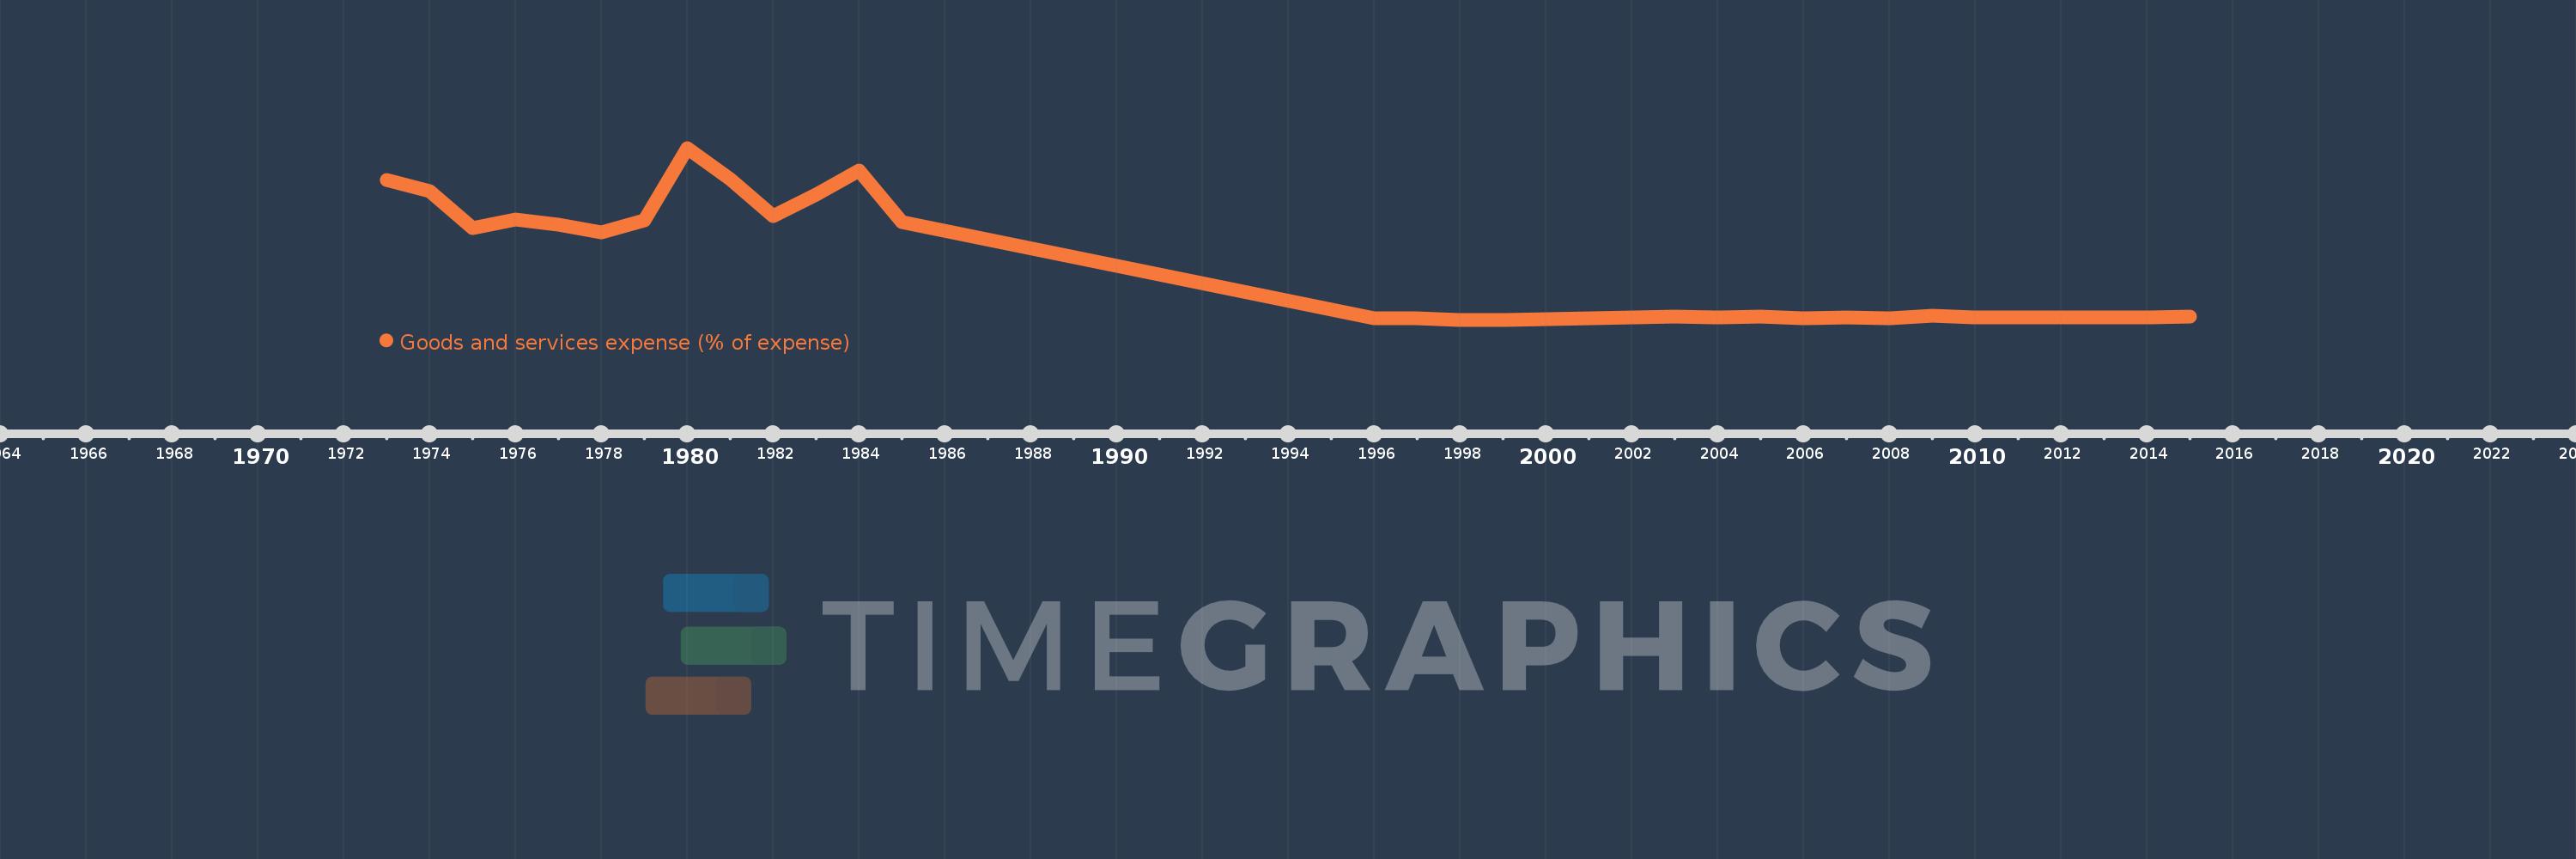
Goods and services expense (% of expense)
2015,2014,2013,2012,2011,2010,2009,2008,2007,2006,2005,2004,2003,2002,2001,2000,1999,1998,1997,1996,1985,1984,1983,1982,1981,1980,1979,1978,1977,1976,1975,1974,1973
